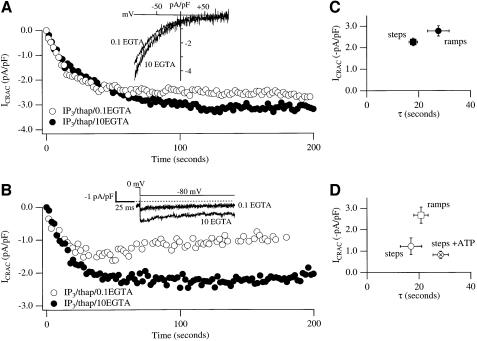
Fig. 1. ICRAC is smaller using hyperpolarizing steps than ramps in weak intracellular Ca2+ buffer. (A) Time-course of ICRAC, followed using voltage ramps, in strong and weak buffer (filled and open circles, respectively). Inset shows I–V relationships taken at 100 s. The current was measured at –80 mV from the ramps, and normalized for cell capacitance. (B) Time-course of ICRAC in strong and weak buffer following voltage steps to –80 mV (inset). The current was measured between 0.8 and 0.9 ms after the step (see Materials and methods). (C) A plot of ICRAC against activation time-constant in strong buffer using ramps or steps. (D) A similar plot to (C) but for low buffer. Note that inclusion of 2 mM Mg-ATP reduces the size of the current.

An official website of the United States government
Here's how you know
Official websites use .gov
A
.gov website belongs to an official
government organization in the United States.
Secure .gov websites use HTTPS
A lock (
) or https:// means you've safely
connected to the .gov website. Share sensitive
information only on official, secure websites.
