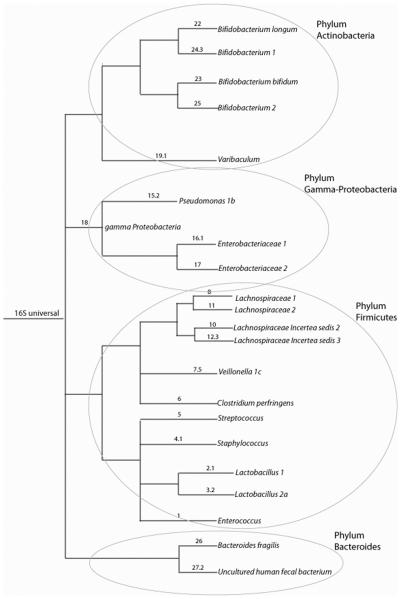
Figure 1.
Cartoon tree representing the phylogenetic grouping of the probes used in the analyses of the data.
The numbers before the punctuation for the labeling of branches represent the number of that phylogroup on the array. If there is a number after the punctuation, more than one probe was evaluated for that particular phylogroup. If the naming of the terminal nodes is not distinct we included numbering for distinction.

