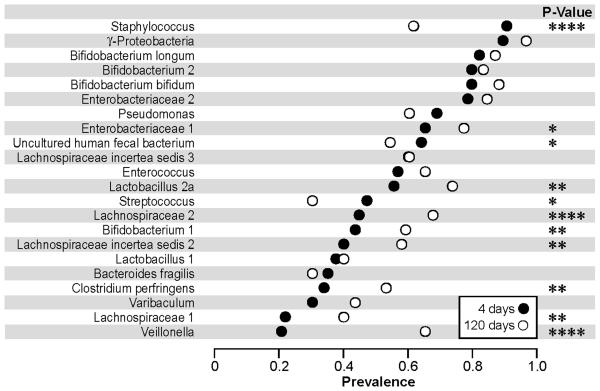
Figure 2.
Prevalence of microbial groups at day 4 and day 120.
The percentage of infants in which each microbial group was detected (above threshold) at day 4 (n=83) and at day 120 (n=83) is plotted. Bacterial groups are ordered by mean prevalence at day 4. The p-values are calculated based on 81 infants with data for both days. **** P-value <0.0001, *** p-value <0.001, ** p-value<0.01 and * p-value<0.05.

