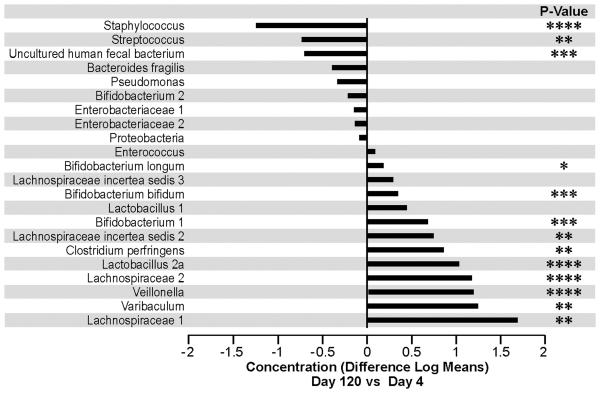
Figure 3.
The mean change in concentration/ expression pattern at day 120 relative to day 4 is shown. Concentrations are defined by log transformed expression intensities. Bacterial groups are ordered by differences in concentrations.
* p-value<0.05, ** p-value<0.01 ***, p-value <0.001****, P-value <0.0001.

