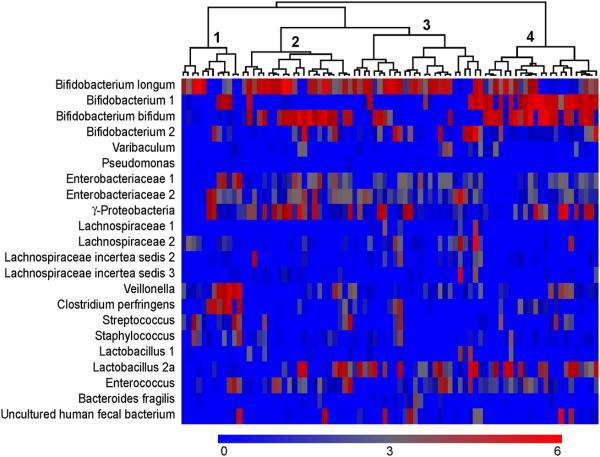
Figure 6.
Heatmap of the concentration of each probe on day 120 for each infant, with hierarchical clustering among study subjects performed using Spearman correlation coefficients as the similarity index. Each column represents one study subject, and the tree shows the subjects who were clustered together. Wards method was used to form the clusters. The scale of the concentration ranges from 0 concentration (deep blue) to the highest concentration (bright red). (Concentrations should only be compared across individuals and not across probes)

