
Figure 6. Kinetics of BV inhibition of NS3/4A protease.
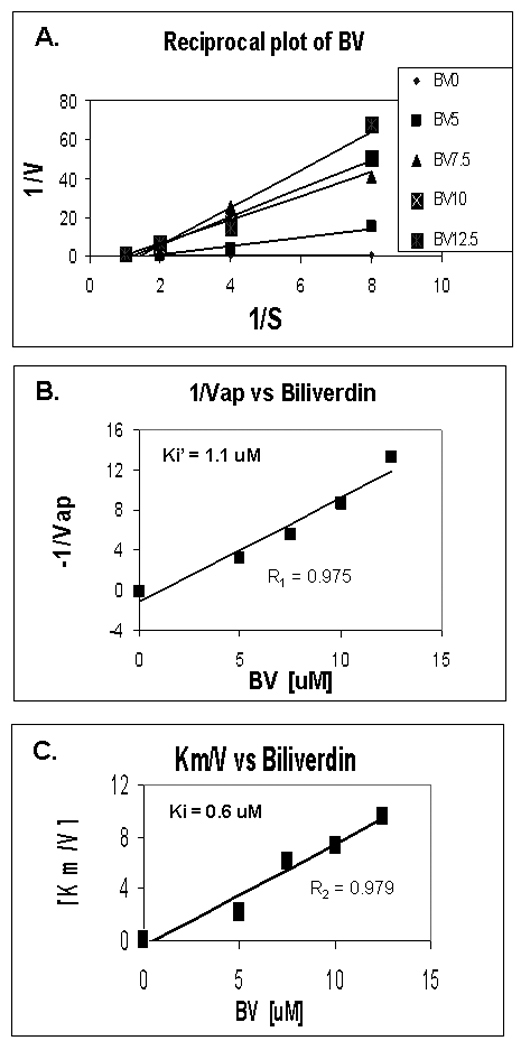
(A) Reciprocal (Lineweaver-Burk) plot of substrate concentration versus enzyme activity. Recombinant protease activity was determined fluorometrically as described in Fig. 5 and Methods. Each point is the mean +/− SEM of 3–5 determinations per point. (B,C) Secondary plots of 1/Vap (y-intercepts) or Km/V (slopes) versus BV concentrations to estimate Ki’ and Ki of BV inhibition non-competitive and competition inhibition respectively. Plot of [BV] vs either 1/Vap or Km/V showed highly significant linearity, (r = 0.975 and r = 0.979 respectively, P< 0.005) suggesting mixed inhibition of NS3/4A protease by BV (Ki’ = 1.1 and Ki = 0.6 µM, respectively).