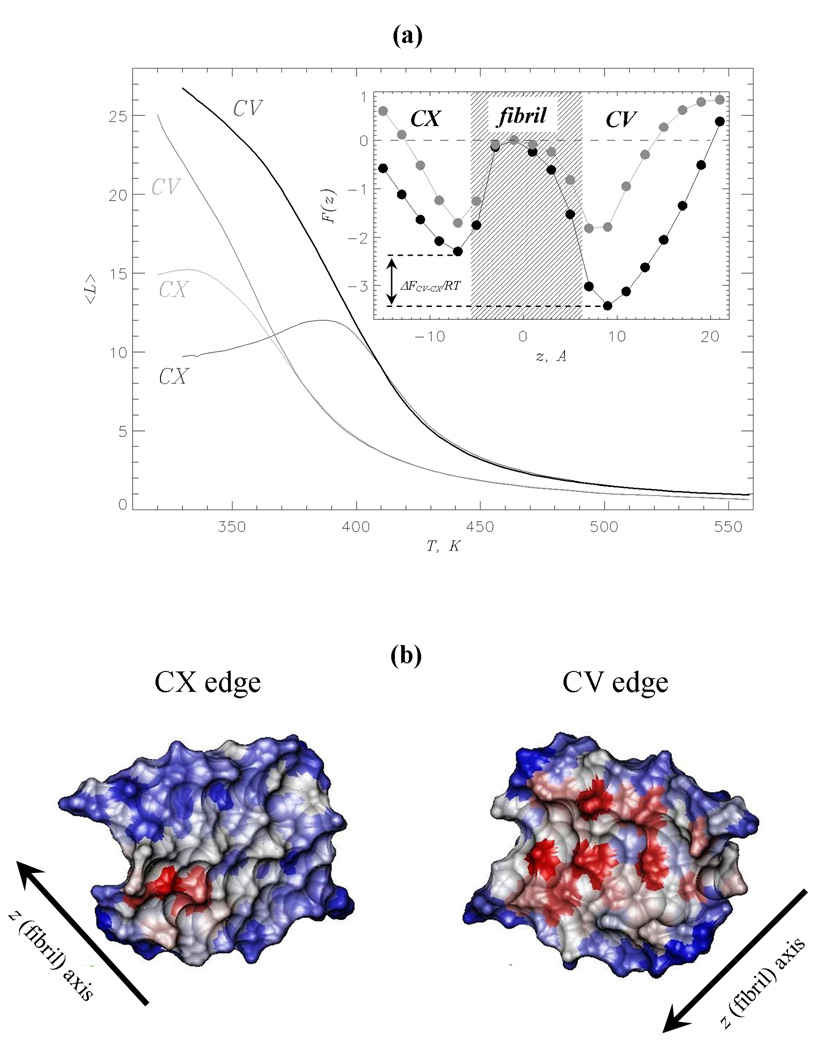
Fig. 3.
(a) The numbers of ligand molecules < L > bound to the CV (thick lines) and CX (thin lines) edges vs temperature. The data for naproxen and ibuprofen35 are shown (including the inset) in black and grey, respectively. Inset: The free energy of a ligand F(z) along the fibril axis z at 360K. Two free energy minima reflect ligand binding to the CV and CX fibril edges. The shaded area approximately marks the maximum extent of fibril fragment. Free energy at the fibril midpoint is set to zero. The free energy gap between the CV and CX bound states, ΔFCV–CX = FCV – FCX, is computed by integrating over the states in the CV and CX minima (using the same procedure as in Fig. 2b). This figure shows that at 360K naproxen binding to CV is thermodynamically preferred, whereas ibuprofen binding to the edges is marginally different. (b) The surfaces of the CV and CX fibril edges accessible to naproxen upon binding at 360K. The surface of residue i in the peptide k is color-coded according to the number of side chain contacts < Cl(i; k) >, which it forms with naproxen: red, grey and blue correspond to large, medium, and small < Cl(i; k) > values, respectively. Accessible surface areas are computed using the probe radius of 3.3Å (naproxen radius of gyration) and visualized using VMD59.

