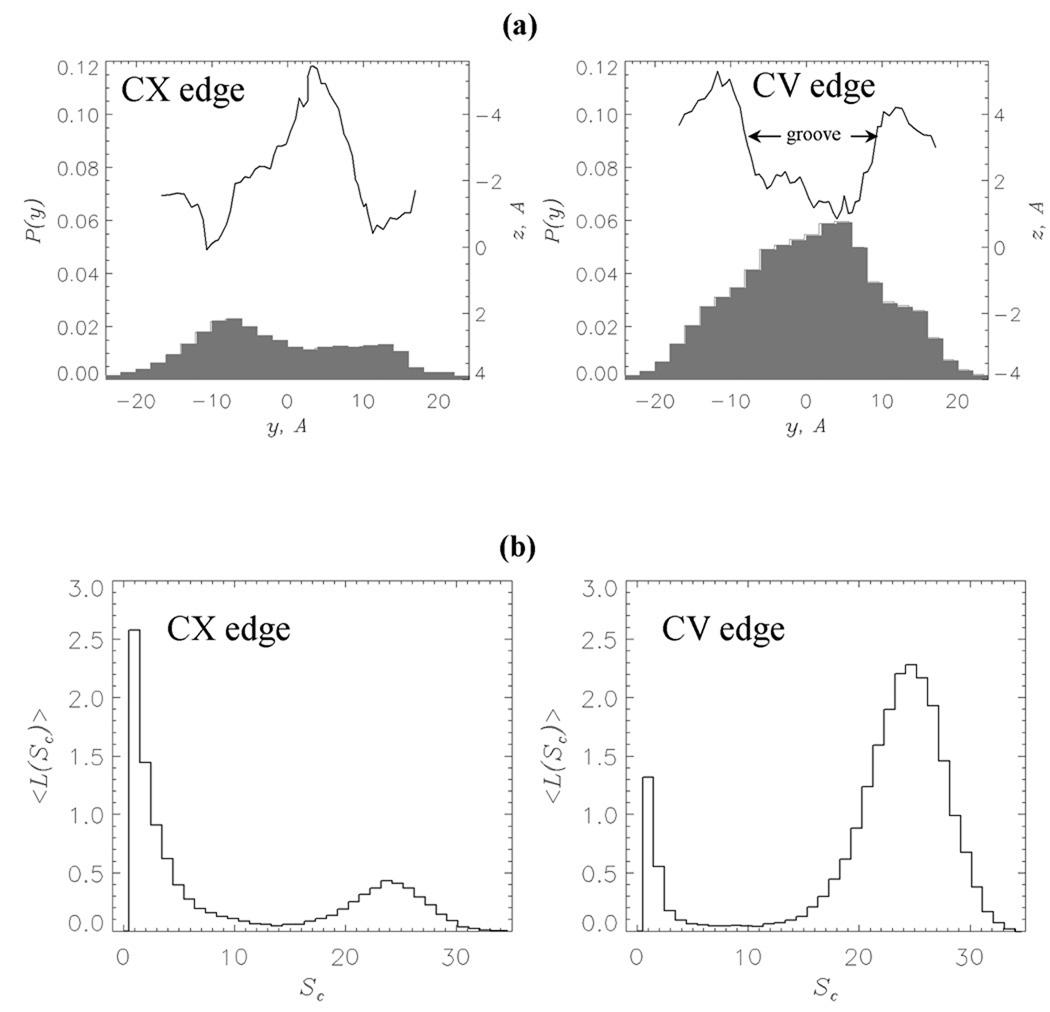
Fig. 4.
(a) Probabilities of occurrence of naproxen molecule center of mass, P(y) (in grey), along the axis y perpendicular to the fibril axis z. The left and right panels are computed for z < 0 (CX edge) and z > 0 (CV edge), respectively (Fig. 1b). Smoothed projections of the edge surfaces on the (y, z) plane are in black. The edge surface is represented by the side chain centers of mass. (b) Distributions of the numbers of bound ligands < L(Sc) > with respect to cluster size Sc. Large peak in < L(Sc) > at Sc = 25 implicates the formation of large clusters of bound ligands localized in the groove on the CV edge (panel (a)). Both panels are obtained at 360K.

