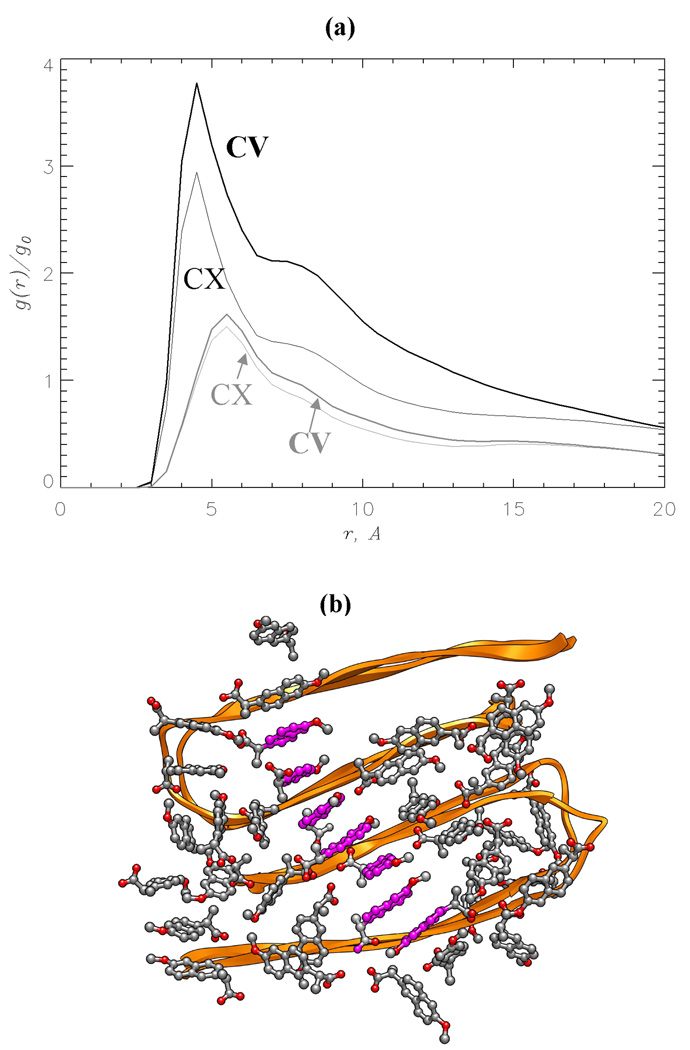
Fig. 5.
(a) The radial distribution functions for ligand number density, g(r): naproxen (in black), ibuprofen (in grey). The distance r is measured from the ligand center of mass. The function g(r) is normalized with the bulk value g0. The plot reveals strong ligand-ligand interactions formed by naproxen as compared to ibuprofen. (b) The snapshot of naproxen ligands bound to Aβ fibril. Interligand interactions result in parallel alignment of naphthalene rings (shown in magenta) of the bound molecules. Both panels are obtained at 360K.

