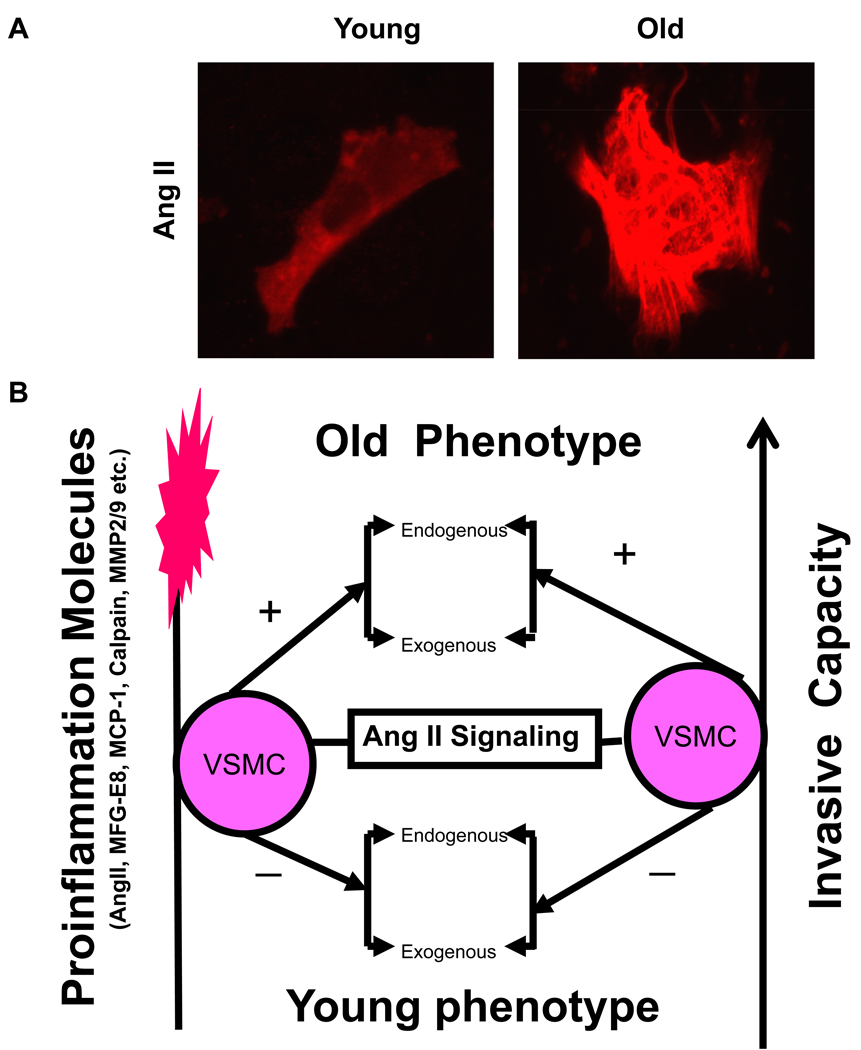
Figure 12. VSMC phenotypic shift during aging.
A. Representative photomicrographs of VSMC with anti-Ang II antibody staining (red). From Wang M et al [6]. B. Simplified schematic of the Ang II signaling and age-associated phenotypic shift of VSMC. +, increase; and −, decrease.

