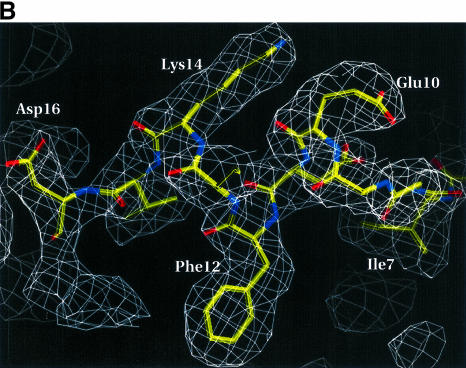
Fig. 1. (A) A representative region of the 1.87 Å experimental electron density map of the E.coli homolog. The map is calculated after solvent flattening and contoured at 1.4σ in the vicinity of Thr42–Val46 (numbers for E.coli protein) and the mercury binding site. The map is superimposed on the refined model. (B) A 2Fo – Fc simulated annealing (2.5 Å, temperature 2000 K) omit map (contoured at 1.3σ) of residues Ile7–Leu17 (omitted from the phase calculation) of the A.aeolicus Trbp111 structure. The refined model for Ile7–Asp16 is also shown. (C) Ribbon representation of the overall structure of the A.aeolicus Trbp111 symmetrical homodimer from the side view with the dimer 2-fold axis running vertically in the plane of the figure. The monomers are shown in different colors. The two OB-fold domains (strands β1–β5 and helix α2), the N-terminal part (helix α1) of the dimerization domain, the loops and the N- and C-termini are labeled. Dotted lines indicate some of the side chain interactions in the dimerization domain. (D) As (C), but with the view looking down the dimer 2-fold axis from the C-terminal region. The C-terminal part (strands β6–β8) of the dimerization domain and loops L8 and L9 are labeled.

An official website of the United States government
Here's how you know
Official websites use .gov
A
.gov website belongs to an official
government organization in the United States.
Secure .gov websites use HTTPS
A lock (
) or https:// means you've safely
connected to the .gov website. Share sensitive
information only on official, secure websites.


