Figure S1.

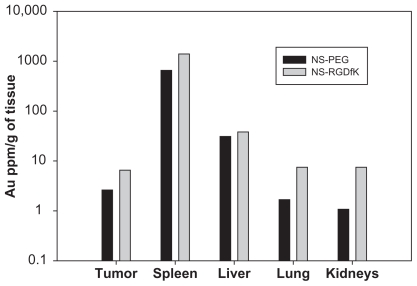
Neutron activation analysis for concentration of gold in tumor, spleen, liver, lung, and kidney at 46 hours postinjection of NS–PEG (control) and NS–RGDfK.

Neutron activation analysis for concentration of gold in tumor, spleen, liver, lung, and kidney at 46 hours postinjection of NS–PEG (control) and NS–RGDfK.