

Abstract
Mounting evidence suggests that genetic risks for mental disorders often interact with the social environment, but most studies still ignore environmental moderation of genetic influences. We tested interactions between maternal parenting and the variable number tandem repeat (VNTR) polymorphism in the 3′ untranslated region (UTR) of the dopamine transporter gene in the child to increase understanding of gene-environment interactions involving early parenting. Participants were part of a 9-year longitudinal study of 4–6-year-old children who met criteria for attention-deficit/hyperactivity disorder (ADHD) and demographically matched controls. Maternal parenting was observed during standard mother-child interactions in wave 1. The child’s conduct disorder (CD) symptoms 5–8 years later were measured using separate structured diagnostic interviews of the mother and youth. Controlling for ADHD symptoms and child disruptive behavior during the mother-child interaction, there was a significant inverse relation between levels of both positive and negative parenting at 4–6 years and the number of later CD symptoms, but primarily among children with two copies of the 9-repeat allele of the VNTR. The significant interaction with negative parenting was replicated in parent and youth reports of CD symptoms separately.
Keywords: gene-environment interaction, dopamine transporter gene, maternal parenting, conduct disorder
It is likely that genetic vulnerabilities are necessary but insufficient for the development of mental disorders (Caspi & Moffitt, 2006; Reiss & Neiderhiser, 2000). Rather, it is probable that the association of genetic polymorphisms with mental disorders is usually conditional upon particular experiences (Meaney & Szyf, 2005; Neiderhiser, 2001). Nonetheless, most molecular genetic studies continue to ignore the potential moderating role of the environment.
The importance of studying gene-environment interaction (GxE) in the mental health field has been clearly articulated and a number of studies have been carried out (Caspi & Moffitt, 2006; Rutter, Moffitt, & Caspi, 2006). To add to our understanding of gene-environment interactions that may be involved in CD, the present study tested potential interactions between parenting in early childhood and a well-characterized polymorphism in predicting CD symptoms that has not heretofore been tested for such interactions, the VNTR polymorphism in the 3′ UTR of the dopamine transporter gene (DAT1) in child.
Rigorous standards for conducting tests of GxE using candidate genes have emerged in recent years (Hunter, 2005; Mill & Petronis, 2007; Moffitt, Caspi, & Rutter, 2005):
1. Biological plausibility
In studies of GxE, candidate genes, environments, and phenotypes should be selected on the basis of a plausible biological model of environmental moderation of gene expression. The dopamine transporter is a solute carrier protein on presynaptic neurons that plays a key role in the regulation of dopaminergic neurotransmission by removing dopamine from the synapse after release (Bertolino et al., 2006). Because the 3′ UTR VNTR polymorphism is not in a coding region of DAT1, it does not regulate the transcription of DNA into messenger RNA (mRNA). Rather, polymorphisms in the 3′ UTR influence the export of mRNA from the cell nucleus, the stability of mRNA, and the translation of mRNA into amino acids and ultimately proteins (Conne, Stutz, & Vassalli, 2000).
Although much remains to be learned, a great deal has been learned in the last 5 years about the potential biological functionality of the DAT1 VNTR. In vitro studies of the expression of the DAT1 VNTR using reporter gene assays and transient transfection in mostly non-human mammalian cell lines have not been helpful, however (Fuke et al., 2001; Michelhaugh, Fiskerstrand, Lovejoy, Bannon, & Quinn, 2001; Mill, Asherson, Browes, D’Souza, & Craig, 2002; Mill, Asherson, Craig, & D’Souza, 2005; VanNess, Owens, & Kilts, 2005). These studies mostly found significant functional differences among the DAT1 genotypes, but in inconsistently varying directions. Brookes et al. (2007) argued that these studies are inconclusive because most of the cell lines did not normally express dopamine and the various clonings were not analogous to the location of the 3′ polymorphism in vivo.
The only published ex vivo study failed to find significant differences associated with the DAT1 VNTR in dopamine transporter availability in postmortem midbrain tissue from deceased older adults (Brookes et al., 2007). Because the availability of the dopamine transporter protein in the striatum declines steadily with age (van Dyck et al., 2005), however, differences in the expression of the dopamine transporter may be difficult to detect in older adults.
In contrast, three in vivo studies of healthy adults using single photon emission computed tomography (SPECT) found consistent evidence of significantly more striatal DAT protein in persons with at least one 9-repeat allele of the DAT1 VNTR (Jacobsen et al., 2000; van de Giessen et al., 2009; van Dyck et al., 2005). A study of 14 abstinent alcoholics and 11 controls reported the opposite result (Heinz et al., 2000), but this could reflect changes in striatal DAT protein associated with long-term alcohol use or rebound during abstinence (Heinz & Goldman, 2000).
The strongest biological evidence regarding the DAT1 VNTR comes from in vivo studies using functional magnetic resonance imaging (fMRI) of differences among genotypes in blood-oxygen-level dependent (BOLD) activation of dopamine-rich fronto-striatal areas of the brain involved in mood, reward, and executive functions. Six studies consistently found greater BOLD activation in the striatum and/or basal ganglia during reward-based, go/no go inhibition, or working memory tasks in participants with the at least one 9-repeat allele of the DAT1 VNTR (Bertolino et al., 2009; Congdon, Constable, Lesch, & Canli, 2009; Dreher, Kohn, Kolachana, Weinberger, & Berman, 2009; Durston et al., 2008; Forbes et al., 2009; Schott et al., 2006). Similarly, four studies consistently found greater activation in regions of the frontal cortex during working memory and cognitive interference tasks in participants with at least one 9-repeat allele (Bertolino et al., 2006; Bertolino et al., 2008; Bertolino et al., 2009; Brown et al., 2010). A fifth study found a nonsignificant trend in the same direction (Caldu et al., 2007).
Neither the SPECT nor fMRI studies provide direct evidence on the biological functionality of the DAT1 VNTR genotype, however, as the significant differences could be due to another polymorphism in strong linkage disequilibrium with the DAT1 VNTR. Nonetheless, these studies suggest that persons with at least one 9-repeat allele have a greater density of the dopamine transporter protein and are more reactive in fronto-striatal networks during tasks activating reward and executive control processes. Unfortunately, the in vivo studies cited above did not clearly distinguish between the 9/9 and 9/10 3′ DAT1 VNTR genotypes. As a result, it is not possible to determine if the significant results reflect additive or nonadditive genetic models.
A meta-analytic review found that children with at least one copy of the 10-repeat allele of the DAT1 3′ VNTR exhibit higher levels of ADHD symptoms than children with no 10-repeat copies, but the effect was quite small (Gizer, Ficks, & Waldman, 2009). CD is another plausible behavioral target for studies of the DAT1 3′ VNTR because it is substantially heritable (Rhee & Waldman, 2002) and there is extensive evidence that the dopaminergic system plays a key role in aggression (de Almeida, Ferrari, Parmigiani, & Miczek, 2005; Laakso et al., 2003), reward (Schultz, 2010), and executive processes (Bertolino et al., 2008; Bertolino et al., 2009). The few previous studies of the association between the 3′ DAT1 VNTR and CD have yielded inconsistent results, however, with three studies not finding a significant main-effect association (Burt & Mikolaiewski, 2008; Schulz-Heik et al., 2008; Sonuga-Barke et al., 2009), one study finding lower levels of antisocial behavior in youth with the 9/9 genotype (Guo, Roettger, & Shih, 2007), and one study finding higher levels of antisocial behavior in persons with the 9/9 genotype (Gerra et al., 2005).
Notably, however, a recent cross-sectional study of 708 European/Caucasian males between the ages of 5 and 17 with ADHD reported an interaction between maternal expressed positive emotion and the 9-repeat allele of the DAT1 3′ VNTR in predicting adult ratings of child conduct problems (Sonuga-Barke et al., 2009). Specifically, greater positive expressed emotion was more strongly associated (inversely) with child conduct problems among children with at least one 9-repeat allele. This suggests the important hypothesis that genotypes of the DAT1 3′ VNTR have not been found to be consistently associated with CD in previous studies because the association is moderated by parenting. That is, the association between DAT1 and CD may have been obscured when important aspects of the environment were not considered.
No other studies of GxE involving parenting and DAT1 have been reported, but an interaction was found between alleles of the dopamine D4 receptor gene (DRD4) and maternal insensitivity toward infants in predicting externalizing behavior at 39 months (Bakermans-Kranenburg & van IJzendoorn, 2006). Similarly, an interaction was found between alleles of DRD4 and maternal parenting quality in predicting maternal ratings of temperamental sensation seeking in toddlers (Sheese, Voelker, Rothbart, & Posner, 2007). These studies also suggest that relations between genetic variants that influence dopaminergic functioning and maladapative child behavior are moderated by maternal parenting.
Much remains to be learned about environmental influences on the expression of the 3′ DAT1 VNTR, but some of the transcription factors are known (Wang, Michelhaugh, & Bannon, 2007) and one study of rats found that maternal deprivation during early rearing significantly reduced expression of the dopamine transporter protein (Zhu et al., 2010). This finding is consistent with robust evidence that variations in maternal parenting can robustly influence the expression of many genes in non-human animals (Meaney & Szyf, 2005; Szyf, McGowan, & Meaney, 2008).
In addition, significant interactions in the cross-sectional association of parenting and latent genetic influences estimated from human twin and sibling correlations (i.e., not from genotypes measured at the molecular level) with adolescent antisocial behavior suggest that as negative parenting increases the proportion of variance in the phenotype attributed to genetic factors decreases (Feinberg, Button, Neiderhiser, Reiss, & Hetherington, 2007). In addition, there is replicated evidence of interactions between retrospectively reported harsh parenting and other genetic polymorphisms, including a long-short promoter variant of the serotonin transporter gene (5HTTLPR), in predicting depression (Caspi et al., 2003; Uher & McGuffin, 2008) and a polymorphism of the monoamine oxidase-A (MAO-A) gene in predicting aggression (Caspi et al., 2002; Kim-Cohen et al., 2006). The latter is potentially relevant to the present study because MAO-A regulates the availability of several neurotransmitters, including dopamine.
It is possible that parenting influences the expression of dopamine system genes and other genes through two related processes (Cole et al., 2007; Meaney & Szyf, 2005). First, DNA is typically quiescent and does not produce mRNA until transcription factors or related proteins bind with promoter sequences. Because stress hormones, such as cortisol, moderate gene expression and are strongly influenced by the social environment (Cole et al., 2007), the social environment can regulate gene expression. Consistent with this view, correlational studies in humans suggest that harsh parenting is associated with elevated cortisol in offspring (Tarullo & Gunnar, 2006). Second, DNA is wound around nucleosomes in the form of chromatin, the structure of which also determines availability of DNA to transcription factors. It has now been established that variations in maternal care can influence the number of bound methyl groups, which influences availability of DNA to transcription through regulation of chromatin structure (Meaney, Szyf, & Seckl, 2007). For example, variation in early maternal parenting in rodents causes enduring changes in chromatin structure, which influences gene expression, a phenomenon known as epigenetic programming (Meaney & Szyf, 2005). Thus, it is plausible to hypothesize that maternal parenting moderates the association between DAT1 and CD.
2. Measurement
Informative tests of GxE require that candidate environments and phenotypes be measured reliably, validly, and in developmentally appropriate ways. Furthermore, the environment and phenotype should be measured by different informants to avoid common method confounds. When studying child and adolescent mental disorders, valid assessments typically require multiple informants (Hart, Lahey, Loeber, & Hanson, 1994). Findings of GxE are strengthened, however, when separately replicated in the reports of multiple informants (Moffitt et al., 2005). Consistent with these recommendations, the candidate environment of maternal parenting was based on direct observations coded by trained observers in the present study whereas symptoms of CD were independently measured using parent and youth reports.
3. Prospective designs
Prospective longitudinal designs avoid recall biases and can rule out reverse causation. For these reasons, they are a minimum requirement for strong tests of GxE (Kraemer, 2010). In the present study, maternal parenting was measured when the children were 4–6 years old and CD was measured in four annual assessments when they were 9–14 years old. Unlike cross-sectional studies, measuring parenting well before measuring the phenotype rules out the possibility that the child’s adolescent CD symptoms influenced parenting at 4–6 years, rather than vice-versa (reverse causation). Nonetheless, child disruptive behavior during the mother-child interaction at 4–6 years was controlled in this study to minimize chances that parenting and later CD were correlated solely because early manifestations of CD influenced early maternal parenting through child effects (Jaffee et al., 2004; Lytton & Romney, 1991).
4. Gene-environment correlation
Tests of GxE can be difficult to interpret in the presence of gene-environment correlation (rGE) (Eaves, Silberg, & Erkanli, 2003; Rathouz, Van Hulle, Rodgers, Waldman, & Lahey, 2008). Therefore, the youth’s genes and the candidate environment must either be uncorrelated or rGE must be taken into account in analyses. Therefore, we test for rGE prior to testing GxE.
5. Sampling
The strongest tests of GxE use data from representative samples or case-control designs (Moffitt et al., 2005; Yang & Khoury, 1997). The present study uses an efficient case-control sample that provides a large number of cases (children with ADHD) and well-matched comparison children (Yang & Khoury, 1997).
6. Statistical analysis
Because violations of the assumption of multivariate normality can result in the “detection” of GxE when none exists (Eaves, 2006), statistical methods must reduce the likelihood of scaling artifacts. Therefore, the present analyses use statistical methods that are not based on the assumption of multivariate normality.
In accordance with these guidelines for rigorous tests of GxE, the present paper reports tests of potential interactions between two dimensions of maternal parenting observed at 4–6 years of age and a VNTR polymorphism in the 3′ UTR of DAT1 in predicting CD symptoms in later childhood. Based on previous studies of the potential importance of early parenting in GxE across species (Caspi & Moffitt, 2006; Meaney, 2006; Rutter, 2008) and the findings reviewed of the association of the 9-repeat allele of DAT1 with dopaminergic functioning and behavior, we predict that maternal parenting will moderate the association between the 9-repeat DAT1 allele and levels of child CD 5–8 years later.
METHODS
Participants
Two cohorts of 3.8–7.0 year old children were recruited in consecutive years in both Chicago and Pittsburgh. Participants all lived with their biological mothers and half initially met DSM-IV diagnostic criteria for ADHD. In Chicago, children with ADHD were recruited from a university child psychiatry clinic. In Pittsburgh, 42% of the children with ADHD were recruited from a university child psychiatry clinic and 58% were recruited through advertisements, but no differences were found between recruitment methods in any demographic variable or measure functional impairment in wave 1 (Lahey et al., 1998). Five potential participants were excluded because of pervasive developmental disorder, mental retardation, or seizure disorder (Lahey et al., 2004). Comparison children were recruited from similar schools and neighborhoods as probands and approximately matched probands on sex, ethnicity, and age. They had never been referred for mental health problems but were not excluded if they met criteria for a disorder other than ADHD. Of 310 eligible participants, 259 parents gave written informed consent after the study was explained; all children gave oral assent. Four children with intelligence scores <70 were later excluded (Lahey et al., 2004).
Demographic and methodologic characteristics of the genotyped participants who were included in the present analyses are presented in Table 1 by genotype group. Similarly, behavioral characteristics of children in the three genotype groups are presented in Table 2.
Table 1.
Demographic and Methodologic Characteristics in Wave 1 of the 169Children Included in Statistical Analyses Grouped by their DAT1 3′ VNTR Genotype
| 9/9 | 9/10 | 10/10 | χ2 | df | |
|---|---|---|---|---|---|
| n = | 12 | 54 | 96 | ||
| Site (% Chicago) | 58.3 | 42.6 | 36.5 | 2.33 | 2 |
| Cohort (% cohort 1) | 50.0 | 37.0 | 35.4 | 0.97 | 2 |
| Age in years (mean, SD): | 5.6 (0.7) | 5.1 (0.7) | 5.2 (0.7) | 1.79 | 2, 162 |
| Sex (% female): | 8.3 | 18.5 | 13.5 | 1.11 | 2 |
| Race-Ethnicity: | 0.61 | 4 | |||
| Non-Hispanic White (%) | 75.0 | 70.4 | 67.7 | ||
| African-American (%) | 16.7 | 24.1 | 26.0 | ||
| Hispanic and Other (%) | 8.3 | 5.6 | 6.2 | ||
| Total family income (mean, SD): | 59,292 (43,078) | 39,537 (30,358) | 44,755 (34,409) | 2.81 | 2, 162 |
Note: Comparisons of differences among the three genotype groups on nominal variables were made using χ2; tests of differences among the groups on variables that were not nominal (family income and counts of CD symptoms in wave 1) were made using Poisson regression. No comparisons of genotype groups significant at p < .05.
Table 2.
Behavioral and Parenting Characteristics of the 169 Children Included in Statistical Analyses by Genotype
| 9/9 | 9/10 | 10/10 | χ2 (df = 2) | |
|---|---|---|---|---|
| n = | 12 | 54 | 96 | |
| Child’s Behavioral Characteristics in Wave 1 | ||||
| Diagnosis of ADHD (%) | 58.3 | 59.3 | 46.9 | 2.34 |
| Number ADHD symptoms (mean, SD) | 8.8 (6.6) | 10.6 (6.0) | 8.3 (7.2) | 3.86 |
| Number CD symptoms (mean, SD) | 1.3 (2.1) | 1.3 (1.8) | 0.8 (1.4) | 4.15 |
| Child disruptive behavior during observation | 9.2 (11.1) | 14.1 (14.6) | 13.8 (16.0) | 1.06 |
| Maternal Parenting in Wave1 | ||||
| Positive parenting during observation | 13.4 (10.2) | 13.1 (9.6) | 12.5 (10.4) | 0.91 |
| Negative parenting during observation | 9.8 (10.4) | 12.5 (13.1) | 11.2 (9.6) | 0.81 |
| CD Symptoms During Outcome Waves | ||||
| Number CD symptoms in wave 6 (mean, SD) | 1.3 (1.5) | 0.9 (1.6) | 0.4 (1.0) | 7.30* |
| Number CD symptoms in wave 7 (mean, SD) | 1.0 (1.8) | 0.7 (1.2) | 0.4 (0.8) | 4.93 |
| Number CD symptoms in wave 8 (mean, SD) | 0.9 (1.2) | 0.4 (1.0) | 0.4 (0.7) | 3.31 |
| Number CD symptoms in wave 9 (mean, SD) | 0.8 (1.4) | 0.5 (1.1) | 0.5 (1.0) | 1.20 |
p < .05
Note: ADHD symptoms = number of symptoms reported by either the parent or the teacher; CD symptoms = number of symptoms reported in each assessment wave by either the parent or the youth (combined); comparisons of differences among the three genotype groups on binary variables were made using χ2; tests of differences among the groups on variables that were not dichotomous (family income and counts of CD symptoms in wave 1) were made using log-linear regression.
Measures
Diagnosis of ADHD
Beginning with the initial assessment when the children were 4–6 years old, approximately annual assessments were conducted by trained lay interviewers, except that no assessment was conducted in the fifth year due to lack of funding. The Diagnostic Interview Schedule for Children (DISC) (Shaffer, Fisher, Piacentini, Schwab-Stone, & Wicks, 1993) was administered to mothers in each assessment. Information was obtained from mothers on DSM-IV diagnostic criteria for a range of mental disorders, including symptoms of ADHD and CD during the last 12 months (Lahey et al., 1998). In each annual assessment, the child’s main teacher completed the DSM-IV version of the DBD Rating Scale (Pelham, Gnagy, Greenslade, & Milich, 1992) by mail. Following standard procedures (Pelham et al., 1992), teacher-reported ADHD symptoms rated “pretty much” or “very much” were scored as present.
The diagnosis of ADHD in year 1 was based on a combination of parent reports of DSM-IV symptoms in DISC interviews and teacher reports on the DBD. We used the standard method (Pelham et al., 1992) of considering teacher ratings of the DBD of “pretty much” or “very much” as indicating that the symptom was present. In the present sample, parent and teacher reports of the number of ADHD symptoms were moderately correlated (rho = .41 – .59). Because reports of ADHD symptoms from parents and teachers each account for independent variance in measures of functional impairment (Hart et al., 1994), parent and teacher reports were combined at the symptom level as in the DSM-IV field trials (Lahey, Applegate, McBurnett et al., 1994). That is, using the standard procedure for the DISC, ADHD symptoms were considered to be present if each symptom was reported by either teacher or parent (Piacentini, Cohen, & Cohen, 1992).
Impairment was assessed in two ways for the diagnosis of ADHD. First, the parent was asked in the DISC if the child’s ADHD symptoms had caused problems (a) at home or with friends, or (b) at school. Second, parents and teachers completed the Impairment Rating Scale (IRS) (Fabiano et al., 2006), in which the child’s need for treatment in multiple areas was rated using 7-point scales ranging from “No problem; definitely does not need treatment” (=0) to “Extreme problem; definitely needs treatment” (=6). Parents rated the child on problems in relations with peers, siblings, and parents, academic progress at school, self-esteem, and impact on the family. Teachers rated problems in relations with classmates and teachers, academic progress, classroom disruption, and self-esteem using the IRS. Both respondents rated the child’s overall need for treatment. For the year 1 diagnosis of ADHD, based on previous studies, children were said to be impaired if they received a rating of 3 on at least one IRS scale (Fabiano et al., 2006).
Children were said to exhibit ADHD if they met DSM-IV symptom criteria and exhibited impairment in at least one setting. We relaxed the DSM-IV requirement of impairment in two settings because previous findings based this sample suggested that 4–6 year olds who meet symptom criteria often do not exhibit impairment in school until later ages and the great majority of children who met criteria for ADHD with impairment in one setting later exhibited impairment in two settings (Lahey, Pelham, Loney, Lee, & Willcutt, 2005). In addition, it is not clear why children with serious impairment in one setting should be excluded from the diagnosis. All diagnosed children met the age of onset criterion for ADHD.
Measures of the CD Phenotype
Beginning in wave 6, when the children were 9–11 years old, independent DISC interviews of the mother and child were conducted concurrently. The DISC was administered to the youth in waves 6–9 to query DSM-IV diagnostic criteria for CD and other disorders. Consistent with other studies (Achenbach, McConaughy, & Howell, 1987), symptoms of CD reported by parents and youth were modestly correlated across waves 6–9 (rho = .13 – .24). Following standard procedures (Piacentini et al., 1992), each CD symptom was considered to be present if it was reported by either the parent or the youth in the analyses of combined parent + youth reports, as in the DSM-IV field trials (Lahey, Applegate, Barkley et al., 1994). Because both parent and youth reports of CD symptoms account for independent variance in functional impairment (Hart et al., 1994), the combination of parent and youth reports may provide the most valid measure of CD symptoms, but tests of GxE also were repeated using reports of CD symptoms from each informant separately to test the replicability of findings across informants.
Observational Measures of Maternal Parenting
During the initial assessment, each mother was videotaped interacting with her child during a structured protocol in a standard room. The room contained chairs, magazines, toys, and a television showing cartoons. After the mother played freely with her child for 10 minutes, an interviewer entered the room and scattered clothes, papers, and empty containers around the room. The interviewer gave the mother a list of instructions and materials. The interviewer quietly reviewed the instructions with the mother before leaving the room. They asked the mother to instruct her child to complete moderately challenging tasks during the remaining 15 minutes: (1) return toys to the shelf; (2) put scattered clothes in a box; (3) place scattered crumpled paper and empty containers in the waste basket; (4) sit at the table and count geometric shapes; (5) copy geometric designs on paper; (6) dust the table with the cloth; (7) work cooperatively with the mother to draw a diagonal line on the Etch-a-Sketch ©; and (8) choose one toy and play quietly while the mother reads and takes a 1 minute telephone call.
Discrete mother and child behaviors were coded continuously from videotapes by coders who were blind to information about the child. Each incident of the child’s disruptive behavior and two mutually exclusive categories of parenting behavior were coded using the standardized and well-validated dyadic parent-child interaction coding system (Robinson & Eyberg, 1981). Two global categories of parenting were defined by summing component scores: (1) negative parenting (critical comments, negative commands (i.e., not to do something), and negative physical contact), and (2) positive parenting (praise, expressions of positive affect, and positive physical contact). No observed instance of negative parenting in this study constituted verbal or physical abuse. The correlation between positive and negative parenting was r = .12, N = 243, p = .06. These categories of maternal parenting behavior have been reported to discriminate children referred for behavior problems from matched healthy controls (Robinson & Eyberg, 1981). Coders were trained to 80% agreement. Coders were supervised with weekly telephone calls and monthly in-person meetings to resolve differences and avoid drift in coding. A primary coder scored all videotapes and a second coder scored a random 30% of the videotapes. Inter-rater reliability was: Cohen’s kappa = .90 for negative parenting, .95 for positive parenting, and .92 for total child disruptive behavior (whining, crying, negative physical behaviors, smart talk, yelling, destructiveness, and noncompliance). In the present sample, positive parenting has been found to inversely predict levels of CD symptoms reported by parents and teachers 5–8 years after the initial assessment among children with ADHD in wave 1 (Chronis et al., 2007).
DNA Collection and Genotyping
The 40 base-pair (bp) VNTR polymorphism located in the 3′-untranslated region of the DAT1 gene (SLC6A3) was genotyped from cheek swabs in 186 of the children. Alleles reflect the number of repeated DNA fragments of the 40-bp sequence, almost entirely 9- or 10-repeats. PCR was carried out in a 10 μl volume containing 50 ng of genomic template, 0.5 μM of each primer, one of which was 5′ fluorescently labeled, 200 μM of each dNTP, 1 × PCR buffer, 1.5 mM MgCl2, and 0.3 units of DyNAzyme™ EXT DNA polymerase (Finnzymes Oy, Espoo, Finland), with 0.5 M GC-melt (Clontech, Palo Alto, CA, USA). The DAT1 primer sequences were 5′-NED-TGTGGTGTAGGGAACGGCCTGAG-3′ and 5′ CTTCCTGGAGGTCACGGCTCAAGG-3′.
Samples were amplified on an Applied Biosystems 9700 thermal cycler (Foster City, CA) with an initial 12-minute step to heat-activate the enzyme at 96°C, followed by 45 cycles of a denaturation step of 96°C for 30 s, an annealing step for 45 s at 68°C, and an extension step of 72°C for 3 min, with final extension step at 72°C for 10min. Post PCR products were purified with Sephadex G-50 gel filtration system, and then added to 10 μl of deionized formamide and 0.5 μl of ROX labeled size standard. PCR products were injected and detected by laser-induced fluorescence on an ABI PRISM 3730 Genetic Analyzer. Electropherograms were processed with Genescan software and alleles were called with Genotyper software, blind to all but a consecutively assigned number. DAT1 genotype frequencies met the assumption of Hardy-Weinberg equilibrium (χ2 = 1.14, p = .39).
Data Analysis
Of the 255 children, 72% (n = 183) were genotyped and 174 had 9/9, 9/10, or 10/10 genotypes. The percent of parents interviewed in waves 6–9 was 94%, 89%, 85%, and 86%, respectively. The child was interviewed in 97–99% of these assessments during waves 6–9. Families that did not participate in one wave typically participated in the next assessment, but four genotyped children dropped out before wave 6. Seven children did not participate in the mother-child interaction task and one had missing data on family income, resulting in a sample for the present analyses of 162 children.
Associations of DAT1 genotypes with CD were analyzed by coding three dummy variables based on the 9/9, 9/10, and 10/10 DAT1 genotypes. Two of the three dummy variables for DAT1 genotype were entered as predictors, with the 10/10 genotype as the reference group. Two df tests were performed in regression models to test for differences among children with the three genotypes and interactions between the parenting measures and genotype, followed by pairwise post-hoc comparisons. Other tests used 1 df unless noted. To normalize the dimensions of positive and negative parenting, the log of each variable plus 1 was taken.
Preliminary cross-sectional tests of year 1 data, including tests of rGE, were conducted using logistic or log-linear regression. Longitudinal tests of associations of genotype and parenting with the repeated measure of the number of CD symptoms reported during the sixth through ninth annual assessments were conducted using longitudinal generalized estimated equations (GEE) applied to log-linear models in SAS GENMOD. An autoregressive (AR1) working covariance structure was assumed, and because the number of CD symptoms was a skewed count variable, the working distribution was specified as Poisson. GEE uses a robust variance estimator for regression coefficient estimates that adjusts for deviations from the specified distribution and covariance structure (Zeger & Liang, 1986).
Sample Bias
To determine if the final sample of 162 included youth was biased, we tested whether included participants differed from the rest of the sample. Log-linear regression revealed that the included and excluded participants did not differ on family income (χ2 = 1.34, p = .25) or CD symptoms (χ2 = 2.78, p = .10) in wave 1, but the youth included in the analyses exhibited more wave 1 ADHD symptoms (χ2 = 4.80, p < .03), requiring this variable to be covaried in all analyses.
Population Stratification
Given the case-control design of this study, we conducted preliminary cross-sectional tests of possible associations between DAT1 genotype and demographic factors that could reflect population stratification of genotypes that confounded tests of association with DAT1 (Lander & Schork, 1994). As reported in Table 1, there were no significant differences among the three DAT1 genotype groups on site, cohort, age, sex, race-ethnicity, or total family income.
Tests of Gene-Environment Correlation
Two-df log-linear regressions indicated that DAT1 was not significantly associated with positive parenting (χ2 = 0.26, p = .88) or negative parenting (χ2 = 0.81, p = .67), providing no evidence of gene-environment correlation that could confound tests of GxE (Eaves et al., 2003; Rathouz et al., 2008).
Tests of GxE
All main effects, methodologic and demographic covariates, time (i.e., repeated assessment waves), and whether each interviewer was blind to information about the youth in each wave were controlled in longitudinal tests of GxE in log-linear GEE models. Because the sample is based on a case-control design and was selected to include children with ADHD and demographically matched non-ADHD comparison children, and because ADHD is correlated with CD (Lee et al., 2007), the combined number of wave 1 ADHD symptoms reported by the parent and teacher also was included as a covariate to minimize the influence of “child effects” on early parenting (Lytton & Romney, 1991). For the same reason, the child’s disruptive behavior during the mother-child interaction was controlled. All covariates were entered simultaneously with dummy codes for genotype. Interactions between DAT1 genotype and each dimension of parenting were tested in the same model using 2-df tests, followed by post hoc tests when significant at p < .05.
RESULTS
Main Effects of Genotype and Maternal Parenting
Parent Report of CD Symptoms
Controlling all demographic and methodologic covariates and the child’s ADHD symptoms in wave 1, the 2-df test of the main effect of DAT1 genotype was not significant for CD symptoms across waves 6–9 (χ2 = 2.93, p = .23). When positive and negative parenting scores and the child’s total disruptive behavior during the mother-child interaction were added to the main effects models for genotypes, neither positive nor negative parenting were associated with CD symptoms during waves 6–9 at p < .10.
Youth Report of CD Symptoms
Controlling all demographic and methodologic covariates and the child’s ADHD symptoms in wave 1, the 2-df test of the main effect of DAT1 genotype was significant for CD symptoms across waves 6–9 (χ2 = 12.43, p = .005). Children with the 9/9 genotype reported more CD symptoms across the period from wave 6 (when they were 9–11 years old) through wave 9 (when they were 12–14 years old) than both children with the 10/10 genotype (β = 0.77, z = 2.83, p < .005) and children with the 9/10 genotype (β = 0.93, z = 3.09, p < .005), but the 9/10 group did not differ from the 10/10 group at p < .05. When positive and negative parenting scores and the child’s total disruptive behavior during the mother-child interaction were added to the main effects models for genotypes, neither positive nor negative parenting were associated with youth-reported CD symptoms during waves 6–9 at p < .10.
Combined Parent+Youth report of CD Symptoms
Controlling all demographic and methodologic covariates and the child’s ADHD symptoms in wave 1, the 2-df test of the main effect of DAT1 genotype was not significant for CD symptoms across waves 6–9 (χ2 = 3.51, p = .17). When positive and negative parenting scores and the child’s total disruptive behavior during the mother-child interaction were added to the main effects models for genotypes, neither dimension of parenting was associated with CD symptoms during waves 6–9 at p < 10.
Tests of Gene-Environment Interaction for CD Symptoms
Parent Report of CD Symptoms
Controlling all demographic and methodologic covariates and the child’s ADHD symptoms in wave 1, the 2-df test of the interaction between negative parenting and DAT1 genotypes was significant (χ2 = 11.99, p < .003). The slope for the 9/9 genotype was significantly more negative than for the 9/10 (χ2 = 10.42, p < .002) and 10/10 genotypes (χ2 = 11.40, p < .005), but the slopes of the 9/10 and 10/10 genotypes did not differ from one another (χ2 = 0.06, p = .81). For positive parenting, the 2-df test of the interaction also was significant (χ2 = 12.25, p < .003). The slope for the 9/9 genotype was significantly more negative than that for the 9/10 (χ2 = 7.62, p < .006) and 10/10 genotypes (χ2 = 12.20, p < .0005), but the slopes of the 9/10 and 10/10 genotypes did not differ (χ2 = 0.58, p = .46).
Youth Report of CD Symptoms
Controlling all demographic and methodologic covariates and the child’s ADHD symptoms in wave 1, the 2-df test of the interaction between negative parenting and DAT1 genotypes was significant (χ2 = 6.15, p < .05). The slope for the 9/9 genotype was significantly more negative than that for the 10/10 genotype (χ2 = 6.11, p < .02), but not significantly different from the 9/10 genotype (χ2 = 1.09, p = .30). The slopes of the 9/10 and 10/10 genotypes did not differ (χ2 = 0.81, p = .37). In contrast, the 2-df test of the interaction between positive parenting and DAT1 genotypes was not significant for youth-reported CD symptoms (χ2 = 1.04, p = .60).
Combined Parent+Youth Report of CD Symptoms
Controlling all demographic and methodologic covariates and the child’s ADHD symptoms in wave 1, the 2-df test of the interaction between negative parenting and DAT1 genotypes was significant, indicating differences among the genotypes in the slopes of the association between negative parenting and the combined report of CD symptoms (χ2 = 14.48, p < .001). As shown in Table 3, interactions between the 9/9 genotype and parenting were significant (using the 10/10 genotype as the comparison), but interactions with the 9/10 genotype were not. When the 9/10 genotype was used as the comparison in a separate analysis (not tabled), interactions between the 10/10 genotype and positive and negative parenting were not significant, z = 0.28, p = .23 and z = 0.04, p = .86, respectively.
Table 3.
Results of Longitudinal Generalized Estimating Equations for Covariates, Genotypes, Parenting, and Genotype × Parenting Interactions Predicting Conduct disorder Symptoms During Assessment Years 6–9
| Predictor |
β |
95% Confidence Interval |
z |
p < |
|---|---|---|---|---|
| Time (assessment waves) | −0.07 | (−0.18 – 0.04) | −1.21 | .23 |
| Site | −0.34 | (−0.93 – 0.25) | −1.13 | .26 |
| Cohort | −0.45 | (−0.94 – 0.05) | −1.77 | .08 |
| Child’s age in year 1 | 0.24 | (−0.09 – 0.57) | 1.42 | .16 |
| Child’s sex | −0.54 | (−1.09 – 0.02) | −1.89 | .06 |
| ADHD symptoms in year 1 | 0.08 | (0.03 – 0.14) | 3.10 | .002 |
| Family income (log) | −0.15 | (−0.35 – 0.05) | −1.47 | .15 |
| African American1 | −0.19 | (−0.78 – 0.40) | −0.63 | .53 |
| Other ethnic group1 | 0.16 | (−0.54 – 0.87) | 0.46 | .65 |
| Parent interviewer blind | −0.05 | (−0.42 – 0.32) | −0.25 | .81 |
| Youth interviewer blind | 0.07 | (−0.24 – 0.38) | 0.47 | .65 |
| 9/9 genotype2 | 4.86 | (3.40 – 6.32) | 6.52 | .0001 |
| 9/10 genotype2 | 0.91 | (−0.49 – 2.31) | 1.27 | .21 |
| Positive parenting3 | 0.02 | (−0.28 – 0.31) | 0.10 | .92 |
| Negative parenting3 | 0.12 | (−0.21 – 0.45) | 0.71 | .48 |
| Child disruptive behavior3 | 0.014 | (−0.01 – 0.02) | 0.89 | .38 |
| 9/9 × positive parenting | −0.80 | (−1.30 – −0.30) | −3.13 | .002 |
| 9/9 × negative parenting | −1.13 | (−1.71 – −0.549) | −3.79 | .0002 |
| 9/10 × positive parenting | −0.28 | (−0.75 – 0.18) | −1.19 | .24 |
| 9/10 × negative parenting | −0.04 | (−0.482 – 0.40) | −0.17 | .87 |
Contrast group is non-Hispanic white
Contrast group is 10/10 genotype
Observed during mother-child interaction task in year 1
Note: Conduct disorder symptoms = number of symptoms reported in each assessment wave by either the parent or the youth (combined); estimates of main effects for genotype and parenting are changed by the presence of interaction terms; all tabled tests of significance used 1 df.
To visualize this interaction, plots of the slopes of negative parenting against the average number of CD symptoms reported during waves 6–9 are presented separately for each genotype in Figure 1. Note that the numbers of CD symptoms across waves 6–9 were averaged solely for the purpose of this illustration; the slopes were generated from longitudinal analyses of the repeated measures of the numbers of CD symptoms in each assessment wave. The same applies to Figure 2 below. As shown in Figure 1, the slope for the 9/9 genotype (slope β = −1.01, p < .001) was significantly more negative (χ2 = 9.87, p < .002) than the slope for the 9/10 genotype (slope β = 0.08, p = .68) and significantly more negative (χ2 =14.33, p < .0002) than the slope for the 10/10 genotype (slope β = 0.12, p = .48). Slopes of the 9/10 and 10/10 genotypes did not differ from one another (χ2 =0.03, p = .86).
Figure 1.
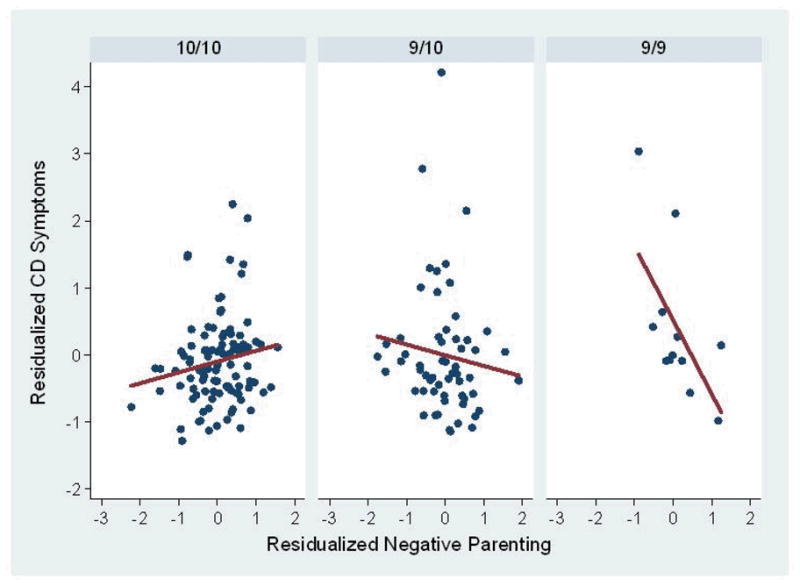
Partial residual plots and regression lines based on linear regression for the association between negative parenting and conduct disorder symptoms reported by parents and youth among children with the three DAT1 genotypes. The mean of the number of CD symptoms in waves 6–9 in each genotype group was taken solely for the purpose of these illustrations; the longitudinal statistical analyses were performed on the unaveraged repeated measures of CD across waves 6–9. In these plots, negative parenting and the mean number of CD symptoms across waves 6–9 are residualized on site, cohort, age in wave 1, the child’s sex and race-ethnicity, the child’s number of ADHD symptoms in wave 1, and the child’s disruptive behavior during the mother-child interaction task.
Figure 2.
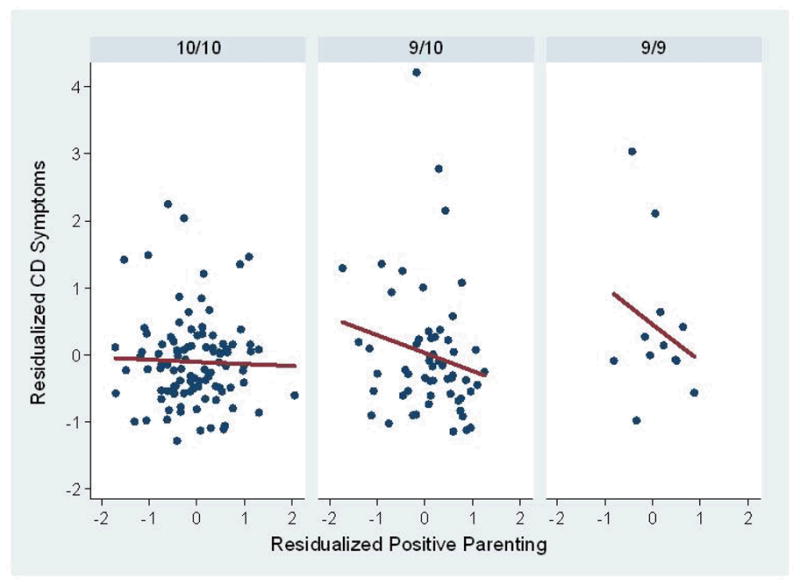
Partial residual plots and regression lines to illustrate the results of linear regression of the association between positive parenting and conduct disorder symptoms across study waves 6–9 reported by parents and youth among children with the three DAT1 genotypes. The mean of the number of CD symptoms in waves 6–9 in each genotype group was taken solely for the purpose of these illustrations; the longitudinal statistical analyses were performed on the unaveraged repeated measures of CD across waves 6–9. In these plots, positive parenting and the mean number of CD symptoms across waves 6–9 are residualized on site, cohort, age in wave 1, the child’s sex and race-ethnicity, the child’s number of ADHD symptoms in wave 1, and the child’s disruptive behavior during the mother-child interaction task.
The 2-df test of the interaction between positive parenting and genotype for the response variable of CD symptoms also was significant (χ2 = 9.82, p < .01). As illustrated in Figure 2, the slope for the 9/9 genotype (slope β = −0.78, p < .002) was significantly more negative (χ2 = 9.82, p < .002) than for the 10/10 genotype (slope β = 0.02, p = .92), but only marginally different (χ2 = 3.62, p = .057) from the 9/10 genotype (β = −0.27, p = .26). The slopes of the 9/10 and 10/10 genotypes did not differ (χ2 = 1.41, p = .23).
Diagnostic and Sensitivity Analyses
We conducted two additional sets of analyses to evaluate the robustness of the findings of GxE for the association of maternal parenting and genotype with later symptoms of CD.
Diagnostic Analyses to Assess the Impact of Highly Influential Participants
We conducted formal diagnostic analyses to determine if the significant parenting-by-genotype interactions were the result of data from a small number of participants who were highly influential (e.g., outliers). Person-level deletion diagnostics were conducted in GEE (Preisser & Qaqish, 1996) using SAS PROC GENMOD. Standardized cluster- level (i.e., participant-level) delta-beta (DBETACS) statistics were computed for the differences in slopes for positive and negative parenting in the comparisons of the 9/9 to the 9/10 and 10/10 genotypes (i.e., the two contrasts that yielded significant differences in slopes). For any regression coefficient, DBETACS approximates the difference in that coefficient estimated for the full data set, compared to the estimate with each participant removed, standardized by the standard error of the regression coefficient. According to the DBETACS statistics, the data for two participants was found to be notably more influential in one or more of the four slope contrasts (i.e., two comparisons each for positive and negative parenting) than the rest of participants. As shown in Table 4, when the parenting-by-genotype interactions were tested with data from these two participants removed, the results were qualitatively identical to the results based on the full data set.
Table 4.
Slopes within genotypes and tests of genotype-by-parenting interactions for the number of conduct disorder symptoms during waves 6–9 for the full sample and when highly-influential participants were dropped
| Full Sample | |||||||||||||
|---|---|---|---|---|---|---|---|---|---|---|---|---|---|
| Slopes |
Interactions with Genotype |
||||||||||||
| 9/9 | 9/10 | 10/10 | 2-df test | 9/9 vs. 9/10 | 9/9 vs. 10/10 | 9/10 vs. 10/10 | |||||||
| Positive Parenting | |||||||||||||
| β | p < | β | p < | β | p < | χ2 | p < | χ2 | p < | χ2 | p < | χ2 | p < |
| −0.78 | .002 | −0.27 | .26 | 0.02 | .92 | 9.82 | .01 | 3.62 | .057 | 9.82 | .002 | 1.41 | .23 |
| Negative Parenting | |||||||||||||
| β | p < | β | p < | β | p < | χ2 | p < | χ2 | p < | χ2 | p < | χ2 | p < |
| −1.01 | .001 | 0.08 | .68 | 0.12 | .48 | 14.48 | .001 | 9.87 | .002 | 14.33 | .0002 | 0.03 | .86 |
| Two Highly-Influential Participants Removed from Sample | |||||||||||||
| Positive Parenting | |||||||||||||
| β | p < | β | p < | β | p < | χ2 | p < | χ2 | p < | χ2 | p < | χ2 | p < |
| −0.84 | .004 | −0.18 | .46 | −0.01 | .97 | 8.67 | .02 | 4.78 | .03 | 8.60 | .004 | 0.54 | .47 |
| Negative Parenting | |||||||||||||
| β | p < | β | p < | β | p < | χ2 | p < | χ2 | p < | χ2 | p < | χ2 | p < |
| −0.47 | .04 | 0.31 | .07 | 0.09 | .58 | 9.68 | .008 | 9.03 | .003 | 6.44 | .02 | 1.10 | .30 |
Note: Conduct disorder symptoms = number of symptoms reported in each assessment wave by either the parent or the youth (combined).
Specifically, with the two highly influential participants removed, the 2-df test of the interaction between negative parenting and DAT1 genotypes for the combined reports of CD symptoms by parents and youth was significant (χ2 = 14.63, p < .001). The slope for the 9/9 genotype was significantly more negative than for the 9/10 (χ2 = 9.23, p = .003) the 10/10 genotype (χ2 = 13.55, p < .0002), but the slopes of the 9/10 and 10/10 genotypes did not differ (χ2 = 0.01, p = .93). For positive parenting, the 2-df test of the interaction also was significant (χ2 = 11.97, p < .003). The slope for the 9/9 genotype was significantly more negative than the 9/10 (χ2 = 5.01, p < .03) and the 10/10 genotypes (χ2 = 11.94, p < .0005), but the slopes of the 9/10 and 10/10 genotypes did not differ (χ2 = 2.11, p = .15). Additionally, in a more conservative test of the robustness of the present findings, we removed all seven participants with absolute DBETACS values > ±.20 from the models testing GxE for positive or negative parenting and found qualitatively identical evidence for both parenting-by-genotype interactions.
Tests of GxE among Only Children with ADHD in Wave 1
Although the number of participants was small (n =87), the interactions between genotype and positive and negative parenting were found with one exception among only those children who met criteria for ADHD in wave 1. Based on combined reports of CD symptoms by parents and youth, the 2-df test of the interaction between negative parenting and DAT1 genotypes was significant (χ2 = 12.32, p < .003). The slope for the 9/9 genotype was only marginally more negative than for the 9/10 (χ2 = 3.36, p = .067), but was significantly more negative than for the 10/10 genotype (χ2 = 11.36, p < .001); slopes of the 9/10 and 10/10 genotypes did not differ significantly (χ2 = 1.25, p = .26). For positive parenting, the 2-df test of the interaction also was significant (χ2 = 6.32, p < .05). The slope for the 9/9 genotype was significantly more negative than for the 9/10 (χ2 = 5.16, p < .03) and 10/10 genotypes (χ2 = 5.21, p < .03), but the slopes of the 9/10 and 10/10 genotypes did not differ (χ2 = 0.26, p = .61).
DISCUSSION
The present findings support the general hypothesis that variations in early parenting interact with the child’s genetic characteristics to influence the development of antisocial behavior (Caspi et al., 2002). Specifically, these findings suggest that the predictive association between maternal parenting at 4–6 years of age and the child’s CD symptoms 5–8 years later varies as a function of the child’s 9-repeat allele of the DAT1 3′ VNTR and vice-versa. Specifically, the inverse association between both negative and positive parenting and future CD symptoms was significantly stronger among children with two copies of the 9-repeat allele than children with other genotypes in the present study. This finding is consistent with the findings of a previous cross-sectional study showing a stronger association between parental expressed emotion and conduct problems among children with at least one copy of the 9-repeat allele of the DAT1 3′ VNTR (Sonuga-Barke et al., 2009).
Only 7% of the current sample had the 9/9 genotype, but for at least two reasons the present findings do not necessarily mean that there are no genetic influences on sensitivity to early parenting associated with the DAT1 3′ VNTR in the 93% of children who did not have the 9/9 genotype. Although the present findings are consistent with a recessive effect of the 9-repeat allele on responsiveness to both positive and negative parenting, the systematic changes in slopes shown in Figures 1 and 2 raise the possibility that a larger sample might reveal significantly more negative slope in the 9/10 than the 10/10 group, consistent with an additive model of genetic transmission associated with the number of 9-repeat alleles. That is, there may be a smaller but significant influence of the 9-repeat allele on sensitivity to parenting in child with only one copy of the allele.
The use of two informants on CD symptoms in the present study provided important advantages. There is evidence that the combination of parent+youth reports of CD symptoms provides the most valid data on child CD symptoms (Bird, Gould, & Staghezza, 1992; Hart et al., 1994; Jensen et al., 1999). Nonetheless, it is important that the significant interaction between genotype and negative parenting was replicated in parent and youth reports of CD separately, even though the interaction involving positive parenting was not. Thus, the replication across informants provides stronger support for the interaction with negative parenting than for positive parenting.
The present findings suggest that different parenting styles may be adaptive for children with different DAT1 VNTR genotypes. If this hypothesis is confirmed in future studies, it would be important to know exactly which aspects of parenting are related to adaptive outcomes among children with each DAT1 genotype and why. As defined in the present study, both positive and negative parenting were inversely related to future CD symptoms in the present study, but primarily among children with two copies of the 9-repeat alleles of the DAT1 3′ VNTR. This suggests that, for reasons not currently understood, both warm and constructive (positive) parenting and parental prohibitions and critical corrective feedback (negative parenting) may function to reduce risk for CD among children with the 9/9 genotype. It is important to note that none of the negative parenting observed in the present study was outside the “normative” range and constituted abusive parenting. Because negative parenting within and outside the normative range appear to be related differently to maladaptive outcomes in children (Jaffee et al., 2004), the present findings do not challenge the hypothesis that child maltreatment fosters antisocial behavior (Caspi et al., 2002).
Given the highly consistent evidence from the in vivo studies reviewed above showing that persons with the 9-repeat allele of the DAT1 3′ VNTR exhibit greater availability of the dopamine transporter and greater functional reactivity in fronto-striatal networks, the present findings could indicate that variations in dopaminergic functioning in brain systems implicated in reward processes and executive control moderate children’s response to early maternal parenting. Therefore, additional strong studies of the interaction of multiple aspects of early maternal parenting with the full range of genetic polymorphisms that influence dopamine system functioning are needed. Consistent with this view, two previous studies have found interactions between a polymorphism of the dopamine reception gene, DRD4, and parenting on child behavior (Bakermans-Kranenburg & van IJzendoorn, 2006; Sheese et al., 2007). A full understanding of genetic influences on sensitivity to parenting will require the systematic study of all of those polymorphisms related to dopamine and far more.
It is important to note that a previous analysis of data from the current longitudinal study found positive parenting in year 1 to inversely predict parent and teacher ratings of CD symptoms across years 2–8 among children who met criteria for ADHD in year 1 (Chronis et al., 2007). In the partially overlapping subset of the sample used in the present analyses, however, the trend towards inverse prediction of parent and youth reports of CD symptoms across years 6–9 did not reach significance at p < .05. This could reflect a greater protective role of early positive parenting among children with ADHD and/or variations in the role of positive parenting according to genotypes of the DAT1 3′ VNTR, which is associated with ADHD in this sample (Chronis et al., 2007).
Limitations
It is important to emphasize that the statistical power of the present study was quite limited. Although the probability of Type I errors (i.e., rejecting a null hypothesis that should not be rejected) is controlled by selecting the alpha level and not by the sample size, caution is warranted in interpreting gene-environment interactions detected in smaller samples (Risch et al., 2009) for several reasons. First, smaller samples are more prone to Type II errors (i.e., the failure to detect small effect sizes). Second, although we carefully evaluated the contributions of outliers in the present analyses, smaller samples are more vulnerable to their effect. Third, it is less likely that small samples adequately represent the population, raising the risk of incorrect estimation of population effect sizes. Fourth, confidence intervals around effect sizes estimated in smaller samples tend to be wider. The latter two issues are problematic because the size of adequate replication samples must be based on the lower bound of the effect size estimated in the original sample, and the lower bound tends to be lower and potentially misestimated in smaller samples. This is an important practical issue as the replication samples used in previous genetic research often have had insufficient statistical power to detect the lower bound of the original effect size, likely leading to inconsistent replications (Chanock et al., 2007; Salanti, Sanderson, & Higgins, 2005).
The present analyses were based on a plausible biological model of GxE, identified robust interaction effects, used strong prospective methods with the environmental moderator and outcome variables being measured by different informants and methods, and replicated the findings of significant interactions with negative parenting in this sample using data on CD from two different informants. In addition, although the sample size for the present study was modest, the fact that the finding of GxE survived two kinds of diagnostic and sensitivity analyses (dropping the most influential participants and limiting the sample to those with a diagnosis of ADHD in wave 1), increases confidence in these findings. Nonetheless, like all such studies, these findings require replication in other samples.
Acknowledgments
This research was supported by grant R01-MH053554 from the National Institute of Mental Health to Benjamin B. Lahey.
Footnotes
Publisher's Disclaimer: The following manuscript is the final accepted manuscript. It has not been subjected to the final copyediting, fact-checking, and proofreading required for formal publication. It is not the definitive, publisher-authenticated version. The American Psychological Association and its Council of Editors disclaim any responsibility or liabilities for errors or omissions of this manuscript version, any version derived from this manuscript by NIH, or other third parties. The published version is available at www.apa.org/pubs/journals/abn
References
- Achenbach TM, McConaughy SH, Howell CT. Child/adolescent behavioral and emotional problems: Implications of cross-informant correlations for situational specificity. Psychological Bulletin. 1987;101:213–232. [PubMed] [Google Scholar]
- Bakermans-Kranenburg MJ, van IJzendoorn MH. Gene-environment interaction of the dopamine D4 receptor (DRD4) and observed maternal insensitivity predicting externalizing behavior in preschoolers. Developmental Psychobiology. 2006;48:406–409. doi: 10.1002/dev.20152. [DOI] [PubMed] [Google Scholar]
- Bertolino A, Blasi G, Latorre V, Rubino V, Rampino A, Sinibaldi L, et al. Additive effects of genetic variation in dopamine regulating genes on working memory cortical activity in human brain. Journal of Neuroscience. 2006;26:3918–3922. doi: 10.1523/JNEUROSCI.4975-05.2006. [DOI] [PMC free article] [PubMed] [Google Scholar]
- Bertolino A, Di Giorgio A, Blasi G, Sambataro F, Caforio G, Sinibaldi L, et al. Epistasis between dopamine regulating genes identifies a nonlinear response of the human hippocampus during memory tasks. Biological Psychiatry. 2008;64:226–234. doi: 10.1016/j.biopsych.2008.02.001. [DOI] [PubMed] [Google Scholar]
- Bertolino A, Fazio L, Di Giorgio A, Blasi G, Romano R, Taurisano P, et al. Genetically determined interaction between the dopamine transporter and the D-2 receptor on prefronto-striatal activity and volume in humans. Journal of Neuroscience. 2009;29(4):1224–1234. doi: 10.1523/JNEUROSCI.4858-08.2009. [DOI] [PMC free article] [PubMed] [Google Scholar]
- Bird HR, Gould MS, Staghezza B. Aggregating data from multiple informants in child psychiatry epidemiological research. Journal of the American Academy of Child & Adolescent Psychiatry. 1992;31:78–85. doi: 10.1097/00004583-199201000-00012. [DOI] [PubMed] [Google Scholar]
- Brookes KJ, Neale BM, Sugden K, Khan N, Asherson P, D’Souza UM. Relationship between VNTR polymorphisms of the human dopamine transporter gene and expression in post-mortem midbrain tissue. American Journal of Medical Genetics Part B-Neuropsychiatric Genetics. 2007;144B:1070–1078. doi: 10.1002/ajmg.b.30572. [DOI] [PubMed] [Google Scholar]
- Brown AB, Biederman J, Valera EM, Doyle AE, Bush G, Spencer T, et al. Effect of dopamine transporter gene (SLC6A3) variation on dorsal anterior cingulate function in attention-deficit/hyperactivity disorder. American Journal of Medical Genetics Part B-Neuropsychiatric Genetics. 2010;153B:365–375. doi: 10.1002/ajmg.b.31022. [DOI] [PMC free article] [PubMed] [Google Scholar]
- Burt SA, Mikolaiewski AJ. Preliminary evidence that specific candidate genes are associated with adolescent-onset antisocial behavior. Aggressive Behavior. 2008;34:437–445. doi: 10.1002/ab.20251. [DOI] [PubMed] [Google Scholar]
- Caldu X, Vendrell P, Bartres-Faz D, Clemente I, Bargallo N, Jurado MA, et al. Impact of the COMT Val(108/158) Met and DAT genotypes on prefrontal function in healthy subjects. Neuroimage. 2007;37:1437–1444. doi: 10.1016/j.neuroimage.2007.06.021. [DOI] [PubMed] [Google Scholar]
- Caspi A, McClay J, Moffitt TE, Mill J, Martin J, Craig IW, et al. Role of genotype in the cycle of violence in maltreated children. Science. 2002;297:851–854. doi: 10.1126/science.1072290. [DOI] [PubMed] [Google Scholar]
- Caspi A, Moffitt TE. Gene-environment interactions in psychiatry: Joining forces with neuroscience. Nature Reviews Neuroscience. 2006;7:583–590. doi: 10.1038/nrn1925. [DOI] [PubMed] [Google Scholar]
- Caspi A, Sugden K, Moffitt TE, Taylor A, Craig IW, Harrington H, et al. Influence of life stress on depression: Moderation by a polymorphism in the 5-HTT gene. Science. 2003;301:386–389. doi: 10.1126/science.1083968. [DOI] [PubMed] [Google Scholar]
- Chanock SJ, Manolio T, Boehnke M, Boerwinkle E, Hunter DJ, Thomas G, et al. Replicating genotype-phenotype associations. Nature. 2007;447:655–660. doi: 10.1038/447655a. [DOI] [PubMed] [Google Scholar]
- Chronis AM, Lahey BB, Pelham WE, Williams SH, Baumann BL, Kipp H, et al. Maternal depression and early positive parenting predict future conduct problems in young children with attention-deficit/hyperactivity disorder. Developmental Psychology. 2007;43:70–82. doi: 10.1037/0012-1649.43.1.70. [DOI] [PubMed] [Google Scholar]
- Cole SW, Hawkley LC, Arevalo JM, Sung CY, Rose RM, Cacioppo JT. Social regulation of gene expression in human leukocytes. Genome Biology. 2007;8:R189. doi: 10.1186/gb-2007-8-9-r189. [DOI] [PMC free article] [PubMed] [Google Scholar]
- Congdon E, Constable RT, Lesch KP, Canli T. Influence of SLC6A3 and COMT variation on neural activation during response inhibition. Biological Psychology. 2009;81:144–152. doi: 10.1016/j.biopsycho.2009.03.005. [DOI] [PMC free article] [PubMed] [Google Scholar]
- Conne B, Stutz A, Vassalli JD. The 3′ untranslated region of messenger RNA: A molecular ‘hotspot’ for pathology? Nature Medicine. 2000;6:637–641. doi: 10.1038/76211. [DOI] [PubMed] [Google Scholar]
- de Almeida RMM, Ferrari PF, Parmigiani S, Miczek KA. Escalated aggressive behavior: Dopamine, serotonin and GABA. European Journal of Pharmacology. 2005;526:51–64. doi: 10.1016/j.ejphar.2005.10.004. [DOI] [PubMed] [Google Scholar]
- Dreher JC, Kohn P, Kolachana B, Weinberger DR, Berman KF. Variation in dopamine genes influences responsivity of the human reward system. Proceedings of the National Academy of Sciences of the United States of America. 2009;106:617–622. doi: 10.1073/pnas.0805517106. [DOI] [PMC free article] [PubMed] [Google Scholar]
- Durston S, Fossella JA, Mulder MJ, Casey BJ, Ziermans TB, Vessaz MN, et al. Dopamine transporter genotype conveys familial risk of attention-deficit/hyperactivity disorder through striatal activation. Journal of the American Academy of Child and Adolescent Psychiatry. 2008;47:61–67. doi: 10.1097/chi.0b013e31815a5f17. [DOI] [PubMed] [Google Scholar]
- Eaves L. Genotype × environment interaction in psychopathology: Fact or artifact? Twin Research and Human Genetics. 2006;9:1–8. doi: 10.1375/183242706776403073. [DOI] [PubMed] [Google Scholar]
- Eaves L, Silberg JL, Erkanli A. Resolving multiple epigenetic pathways to adolescent depression. Journal of Child Psychology and Psychiatry. 2003;44:1006–1014. doi: 10.1111/1469-7610.00185. [DOI] [PubMed] [Google Scholar]
- Fabiano GA, Pelham WE, Waschbusch DA, Gnagy EM, Lahey BB, Chronis AM, et al. A practical measure of impairment: Psychometric properties of the impairment rating scale in samples of children with attention deficit hyperactivity disorder and two school-based samples. Journal of Clinical Child and Adolescent Psychology. 2006;35:369–385. doi: 10.1207/s15374424jccp3503_3. [DOI] [PubMed] [Google Scholar]
- Feinberg ME, Button TMM, Neiderhiser JM, Reiss D, Hetherington EM. Parenting and adolescent antisocial behavior and depression: Evidence of genotype × parenting environment interaction. Archives of General Psychiatry. 2007;64:457–465. doi: 10.1001/archpsyc.64.4.457. [DOI] [PubMed] [Google Scholar]
- Forbes EE, Brown SM, Kimak M, Ferrell RE, Manuck SB, Hariri AR. Genetic variation in components of dopamine neurotransmission impacts ventral striatal reactivity associated with impulsivity. Molecular Psychiatry. 2009;14:60–70. doi: 10.1038/sj.mp.4002086. [DOI] [PMC free article] [PubMed] [Google Scholar]
- Fuke S, Suo S, Takahashi N, Koike H, Sasagawa N, Ishiura S. The VNTR polymorphism of the human dopamine transporter (DAT1) gene affects gene expression. Pharmacogenomics Journal. 2001;1:152–156. doi: 10.1038/sj.tpj.6500026. [DOI] [PubMed] [Google Scholar]
- Gerra G, Garofano L, Pellegrini C, Bosari S, Zaimovic A, Moi G, et al. Allelic association of a dopamine transporter gene polymorphism with antisocial behaviour in heroin-dependent patients. Addiction Biology. 2005;10:275–281. doi: 10.1080/13556210500223769. [DOI] [PubMed] [Google Scholar]
- Gizer IR, Ficks C, Waldman ID. Candidate gene studies of ADHD: a meta-analytic review. Human Genetics. 2009;126:51–90. doi: 10.1007/s00439-009-0694-x. [DOI] [PubMed] [Google Scholar]
- Guo G, Roettger ME, Shih JC. Contributions of the DAT1 and DRD2 genes to serious and violent delinquency among adolescents and young adults. Human Genetics. 2007;121:125–136. doi: 10.1007/s00439-006-0244-8. [DOI] [PubMed] [Google Scholar]
- Hart EL, Lahey BB, Loeber R, Hanson KS. Criterion validity of informants in the diagnosis of disruptive behavior disorders in children: A preliminary study. Journal of Consulting and Clinical Psychology. 1994;62:410–414. doi: 10.1037/0022-006X.62.2.410. [DOI] [PubMed] [Google Scholar]
- Heinz A, Goldman D. Genotype effects on neurodegeneration and neuroadaptation in monoaminergic neurotransmitter systems. Neurochemistry International. 2000;37:425–432. doi: 10.1016/s0197-0186(00)00057-7. [DOI] [PubMed] [Google Scholar]
- Heinz A, Goldman D, Jones DW, Palmour R, Hommer D, Gorey JG, et al. Genotype influences in vivo dopamine transporter availability in human striatum. Neuropsychopharmacology. 2000;22:133–139. doi: 10.1016/S0893-133X(99)00099-8. [DOI] [PubMed] [Google Scholar]
- Hunter DJ. Gene–environment interactions in human diseases. Nature Reviews Genetics. 2005;6:287–298. doi: 10.1038/nrg1578. [DOI] [PubMed] [Google Scholar]
- Jacobsen LK, Staley JK, Zoghbi S, Seibyl JP, Kosten TR, Innis RB, et al. Prediction of dopamine transporter binding availability by genotype: A preliminary report. American Journal of Psychiatry. 2000;157:1700–1703. doi: 10.1176/appi.ajp.157.10.1700. [DOI] [PubMed] [Google Scholar]
- Jaffee SR, Caspi A, Moffitt TE, Polo-Tomas M, Price TS, Taylor A. The limits of child effects: Evidence for genetically mediated child effects on corporal punishment but not on physical maltreatment. Developmental Psychology. 2004;40:1047–1058. doi: 10.1037/0012-1649.40.6.1047. [DOI] [PubMed] [Google Scholar]
- Jensen PS, Rubio-Stipec M, Canino G, Bird HR, Dulcan MK, Schwab-Stone ME, et al. Parent and child contributions to diagnosis of mental disorder: Are both informants always necessary? Journal of the American Academy of Child & Adolescent Psychiatry. 1999;38:1569–1579. doi: 10.1097/00004583-199912000-00019. [DOI] [PubMed] [Google Scholar]
- Kim-Cohen J, Caspi A, Taylor A, Williams B, Newcombe R, Craig IW, et al. MAOA, maltreatment, and gene-environment interaction predicting children’s mental health: New evidence and a meta-analysis. Molecular Psychiatry. 2006;11:903–913. doi: 10.1038/sj.mp.4001851. [DOI] [PubMed] [Google Scholar]
- Kraemer HC. Epidemiological methods: About time. International Journal of Environmental Research and Public Health. 2010;7:29–45. doi: 10.3390/ijerph7010029. [DOI] [PMC free article] [PubMed] [Google Scholar]
- Laakso A, Wallius E, Kajander J, Bergman J, Eskola O, Solin O, et al. Personality traits and striatal dopamine synthesis capacity in healthy subjects. American Journal of Psychiatry. 2003;160:904–910. doi: 10.1176/appi.ajp.160.5.904. [DOI] [PubMed] [Google Scholar]
- Lahey BB, Applegate B, Barkley RA, Garfinkel B, McBurnett K, Kerdyk L, et al. DSM-IV field trials for oppositional defiant disorder and conduct disorder in children and adolescents. American Journal of Psychiatry. 1994;151:1163–1171. doi: 10.1176/ajp.151.8.1163. [DOI] [PubMed] [Google Scholar]
- Lahey BB, Applegate B, McBurnett K, Biederman J, Greenhill L, Hynd GW, et al. DSM-IV field trials for attention-deficit/hyperactivity disorder in children and adolescents. American Journal of Psychiatry. 1994;151:1673–1685. doi: 10.1176/ajp.151.11.1673. [DOI] [PubMed] [Google Scholar]
- Lahey BB, Loeber R, Quay HC, Applegate B, Shaffer D, Waldman I, et al. Validity of DSM-IV subtypes of conduct disorder based on age of onset. Journal of the American Academy of Child and Adolescent Psychiatry. 1998;37:435–442. doi: 10.1097/00004583-199804000-00022. [DOI] [PubMed] [Google Scholar]
- Lahey BB, Pelham WE, Loney J, Kipp H, Ehrhardt A, Lee SS, et al. Three-year predictive validity of DSM-IV attention deficit/hyperactivity disorder in children diagnosed at 4–6 years of age. American Journal of Psychiatry. 2004;161:2014–2020. doi: 10.1176/appi.ajp.161.11.2014. [DOI] [PubMed] [Google Scholar]
- Lahey BB, Pelham WE, Loney J, Lee SS, Willcutt E. Instability of the DSM-IV subtypes of ADHD from preschool through elementary school. Archives of General Psychiatry. 2005;62:896–902. doi: 10.1001/archpsyc.62.8.896. [DOI] [PubMed] [Google Scholar]
- Lander ES, Schork NJ. Genetic dissection of complex traits. Science. 1994;265:2037–2048. doi: 10.1126/science.8091226. [DOI] [PubMed] [Google Scholar]
- Lee SS, Lahey BB, Waldman ID, Van Hulle CA, Rathouz PJ, Pelham WE, et al. Association of dopamine transporter genotype with disruptive behavior disorders in an eight-year longitudinal study of children and adolescents. American Journal of Medical Genetics Part B: Neuropsychiatric Genetics. 2007;144:310–317. doi: 10.1002/ajmg.b.30447. [DOI] [PubMed] [Google Scholar]
- Lytton H, Romney DM. Parents’ socialization of boys and girls: A meta- analysis. Psychological Bulletin. 1991;109:267–296. [Google Scholar]
- Meaney MJ. Maternal care, gene expression, and the transmission of individual differences in stress reactivity across generations. Annual Review of Neuroscience. 2006;24:1161–1192. doi: 10.1146/annurev.neuro.24.1.1161. [DOI] [PubMed] [Google Scholar]
- Meaney MJ, Szyf M. Maternal care as a model for experience-dependent chromatin plasticity. Trends in Neuroscience. 2005;28:456–463. doi: 10.1016/j.tins.2005.07.006. [DOI] [PubMed] [Google Scholar]
- Meaney MJ, Szyf M, Seckl JR. Epigenetic mechanisms of perinatal programming of hypothalamic-pituitary-adrenal function and health. Trends in Molecular Medicine. 2007;13:269–277. doi: 10.1016/j.molmed.2007.05.003. [DOI] [PubMed] [Google Scholar]
- Michelhaugh SK, Fiskerstrand C, Lovejoy E, Bannon MJ, Quinn JP. The dopamine transporter gene (SLC6A3) variable number of tandem repeats domain enhances transcription in dopamine neurons. Journal of Neurochemistry. 2001;79:1033–1038. doi: 10.1046/j.1471-4159.2001.00647.x. [DOI] [PubMed] [Google Scholar]
- Mill J, Asherson P, Browes C, D’Souza U, Craig I. Expression of the dopamine transporter gene is regulated by the 3′ UTR VNTR: Evidence from brain and lymphocytes using quantitative RT-PCR. American Journal of Medical Genetics. 2002;114:975–979. doi: 10.1002/ajmg.b.10948. [DOI] [PubMed] [Google Scholar]
- Mill J, Asherson P, Craig I, D’Souza UM. Transient expression analysis of allelic variants of a VNTR in the dopamine transporter gene (DAT1) BMC Genetics. 2005;6(3) doi: 10.1186/1471-2156-6-3. [DOI] [PMC free article] [PubMed] [Google Scholar]
- Mill J, Petronis A. Molecular studies of major depressive disorder: The epigenetic perspective. Molecular Psychiatry. 2007;12:799–814. doi: 10.1038/sj.mp.4001992. [DOI] [PubMed] [Google Scholar]
- Moffitt TE, Caspi A, Rutter M. Strategy for investigating interactions between measured genes and measured environments. Archives of General Psychiatry. 2005;62:473–481. doi: 10.1001/archpsyc.62.5.473. [DOI] [PubMed] [Google Scholar]
- Neiderhiser JM. Understanding the roles of genome and envirome: methods in genetic epidemiology. British Journal of Psychiatry. 2001;178:S12–S17. doi: 10.1192/bjp.178.40.s12. [DOI] [PubMed] [Google Scholar]
- Pelham WE, Gnagy EM, Greenslade KE, Milich R. Teacher ratings of DSM-III-R symptoms of the disruptive behavior disorders. Journal of the American Academy of Child and Adolescent Psychiatry. 1992;31:210–218. doi: 10.1097/00004583-199203000-00006. [DOI] [PubMed] [Google Scholar]
- Piacentini JC, Cohen P, Cohen J. Combining discrepant diagnostic information from multiple sources: Are complex algorithms better than simple ones? Journal of Abnormal Child Psychology. 1992;20:51–62. doi: 10.1007/BF00927116. [DOI] [PubMed] [Google Scholar]
- Preisser JS, Qaqish BF. Deletion diagnostics for generalised estimating equations. Biometrika. 1996;83:551–562. [Google Scholar]
- Rathouz PJ, Van Hulle CA, Rodgers JL, Waldman I, Lahey BB. Specification, testing, and interpretation of gene-by-measured-environment interaction models in the presence of gene-environment correlation. Behavior Genetics. 2008;38:301–315. doi: 10.1007/s10519-008-9193-4. [DOI] [PMC free article] [PubMed] [Google Scholar]
- Reiss D, Neiderhiser JM. The interplay of genetic influences and social processes in developmental theory: Specific mechanisms are coming into view. Development and Psychopathology. 2000;12:357–374. doi: 10.1017/s0954579400003060. [DOI] [PubMed] [Google Scholar]
- Rhee SH, Waldman ID. Genetic and environmental influences on antisocial behavior: A meta-analysis of twin and adoption studies. Psychological Bulletin. 2002;128:490–529. [PubMed] [Google Scholar]
- Risch N, Herrell R, Lehner T, Liang KY, Eaves L, Hoh J, et al. Interaction between the serotonin rransporter gene (5-HTTLPR), stressful life events, and risk of depression: A meta-analysis. JAMA. 2009;301:2462–2471. doi: 10.1001/jama.2009.878. [DOI] [PMC free article] [PubMed] [Google Scholar]
- Robinson EA, Eyberg SM. The dyadic parent-child interaction coding system: Standardization and validation. Journal of Consulting and Clinical Psychology. 1981;49:245–250. doi: 10.1037//0022-006x.49.2.245. [DOI] [PubMed] [Google Scholar]
- Rutter M. Biological implications of gene-environment interaction. Journal of Abnormal Child Psychology. 2008;36:969–975. doi: 10.1007/s10802-008-9256-2. [DOI] [PubMed] [Google Scholar]
- Rutter M, Moffitt TE, Caspi A. Gene-environment interplay and psychopathology: Multiple varieties but real effects. Journal of Child Psychology and Psychiatry. 2006;47:226–261. doi: 10.1111/j.1469-7610.2005.01557.x. [DOI] [PubMed] [Google Scholar]
- Salanti G, Sanderson S, Higgins JPT. Obstacles and opportunities in meta-analysis of genetic association studies. Genetics in Medicine. 2005;7:13–20. doi: 10.1097/01.gim.0000151839.12032.1a. [DOI] [PubMed] [Google Scholar]
- Schott BH, Seidenbecher CI, Fenker DB, Lauer CJ, Bunzeck N, Bernstein HG, et al. The dopaminergic midbrain participates in human episodic memory formation: Evidence from genetic imaging. Journal of Neuroscience. 2006;26:1407–1417. doi: 10.1523/JNEUROSCI.3463-05.2006. [DOI] [PMC free article] [PubMed] [Google Scholar]
- Schultz W. Dopamine signals for reward value and risk: basic and recent data. Behavioral and Brain Functions. 2010;6:9. doi: 10.1186/1744-9081-6-24. [DOI] [PMC free article] [PubMed] [Google Scholar]
- Schulz-Heik RJ, Maentz SK, Rhee SH, Gelhorn HL, Young SE, Timberlake DS, et al. Case-control and within-family tests for an association between conduct disorder and DAT1. Psychiatric Genetics. 2008;18:17–24. doi: 10.1097/YPG.0b013e3282ef48c8. [DOI] [PubMed] [Google Scholar]
- Shaffer D, Fisher P, Piacentini J, Schwab-Stone M, Wicks J. Diagnostic Interview Schedule for Children. New York: Columbia University; 1993. [Google Scholar]
- Sheese BE, Voelker PM, Rothbart MK, Posner MI. Parenting quality interacts with genetic variation in dopamine receptor D4 to influence temperament in early childhood. Development and Psychopathology. 2007;19:1039–1046. doi: 10.1017/S0954579407000521. [DOI] [PubMed] [Google Scholar]
- Sonuga-Barke EJS, Oades RD, Psychogiou L, Chen W, Franke B, Buitelaar J, et al. Dopamine and serotonin transporter genotypes moderate sensitivity to maternal expressed emotion: the case of conduct and emotional problems in attention deficit/hyperactivity disorder. Journal of Child Psychology and Psychiatry. 2009;50:1052–1063. doi: 10.1111/j.1469-7610.2009.02095.x. [DOI] [PubMed] [Google Scholar]
- Szyf M, McGowan P, Meaney MJ. The social environment and the epigenome. Environmental and Molecular Mutagenesis. 2008;49:46–60. doi: 10.1002/em.20357. [DOI] [PubMed] [Google Scholar]
- Tarullo AR, Gunnar MR. Child maltreatment and the developing HPA axis. Hormones and Behavior. 2006;50:632–639. doi: 10.1016/j.yhbeh.2006.06.010. [DOI] [PubMed] [Google Scholar]
- Uher R, McGuffin P. The moderation by the serotonin transporter gene of environmental adversity in the aetiology of mental illness: review and methodological analysis. Molecular Psychiatry. 2008;13:131–146. doi: 10.1038/sj.mp.4002067. [DOI] [PubMed] [Google Scholar]
- van de Giessen EM, de Win MML, Tanck MWT, van den Brink W, Baas F, Booij J. Striatal dopamine transporter availability associated with polymorphisms in the dopamine transporter gene SLC6A3. Journal of Nuclear Medicine. 2009;50:45–52. doi: 10.2967/jnumed.108.053652. [DOI] [PubMed] [Google Scholar]
- van Dyck CH, Malison RT, Jacobsen LK, Seibyl JP, Staley JK, Laruelle M, et al. Increased dopamine transporter availability associated with the 9-repeat allele of the SLC6A3 gene. Journal of Nuclear Medicine. 2005;46:745–751. [PubMed] [Google Scholar]
- VanNess SH, Owens MJ, Kilts CD. The variable number of tandem repeats element in DATI regulates in vitro dopamine transporter density. BMC Genetics. 2005;6(55) doi: 10.1186/1471-2156-6-55. [DOI] [PMC free article] [PubMed] [Google Scholar]
- Wang J, Michelhaugh SK, Bannon MJ. Valproate robustly increases Sp transcription factor-mediated expression of the dopamine transporter gene within dopamine cells. European Journal of Neuroscience. 2007;25:1982–1986. doi: 10.1111/j.1460-9568.2007.05460.x. [DOI] [PubMed] [Google Scholar]
- Yang QH, Khoury MJ. Evolving methods in genetic epidemiology: 3. Gene-environment interaction in epidemiologic research. Epidemiologic Reviews. 1997;19:33–43. doi: 10.1093/oxfordjournals.epirev.a017944. [DOI] [PubMed] [Google Scholar]
- Zeger SL, Liang KY. Longitudinal data analysis for discrete and continuous outcomes. Biometrics. 1986;42:121–130. [PubMed] [Google Scholar]
- Zhu XZ, Li T, Peng SF, Ma XL, Chen XG, Zhang XW. Maternal deprivation-caused behavioral abnormalities in adult rats relate to a non-methylation-regulated D2 receptor levels in the nucleus accumbens. Behavioural Brain Research. 2010;209:281–288. doi: 10.1016/j.bbr.2010.02.005. [DOI] [PubMed] [Google Scholar]