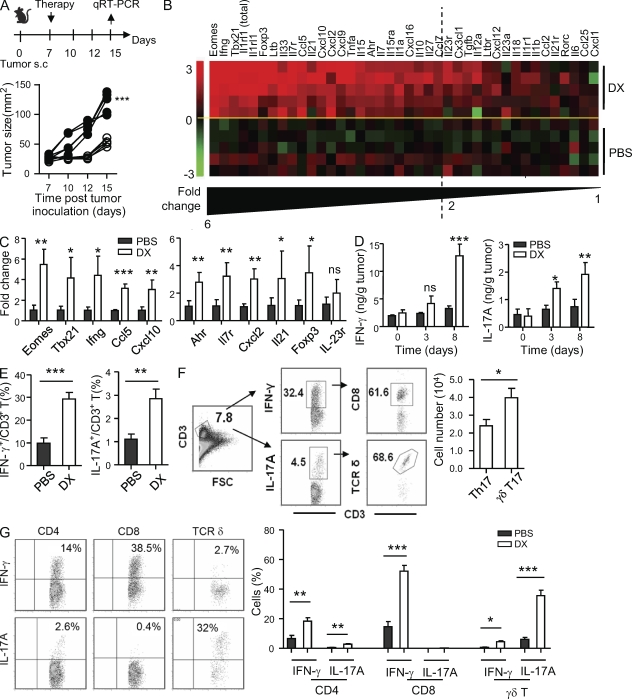
Figure 1.
Th1 and Th17 immune response in tumors after chemotherapy. (A) Mice bearing MCA205 tumors were treated with PBS (solid symbols) or DX (open symbols) intratumorally at day 7 after tumor inoculation. Tumor growth was monitored at the indicated time points. (B and C) 8 d after chemotherapy (day 15 after tumor inoculation), tumor homogenates in PBS and DX groups were tested by quantitative RT-PCR (qRT-PCR). (B) Fold changes of gene expression are shown as a heat map. (C) Th1- and Th17-related gene expression in DX versus PBS groups (with a fold change >2) are listed. (D) Measurements of IFN-γ and IL-17A protein in tumor homogenates by ELISA at the indicated time points. (E and F) Single-cell suspension of MCA205 tumors (day 8 after DX) were analyzed by FACS. (E) Expression of IFN-γ and IL-17A in TILs was tested by intracellular staining gated on live, CD45+ and CD3+ cells. (F) IFN-γ+ and IL-17A+ cells were gated, and the proportions of CD3+ CD8+ cells and CD3+ TCR δ+ cells were examined in DX-treated tumors. A typical dot plot analysis (left) and the absolute numbers of Th17 and γδ T17 cells in the whole tumors (right) are shown. (G) IFN-γ and IL-17A production by total CD4+, CD8+, and TCR δ+ TILs. Representative FACS plots in DX-treated tumors (left) and the percentages in PBS- or DX-treated tumors (right) are shown. Each group contained at least five mice, and each experiment was performed at least twice, yielding similar results. Graphs depict mean ± SEM of fold change of gene expression (C), protein content (D), percentages, or absolute numbers of positive cells (E and G). *, P < 0.05; **, P < 0.01; ***, P < 0.001.

