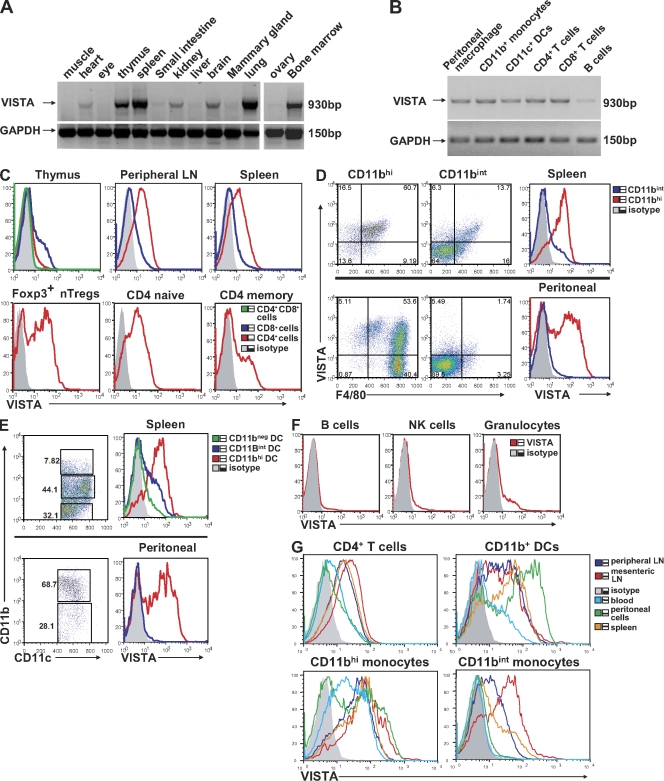
Figure 2.
Tissue expression and hematopoietic cell expression patterns of VISTA. (A and B) RT-PCR of full-length VISTA from mouse tissues (A) and from mouse hematopoietic cell types (B). GAPDH was used as a loading control. (C–F) Flow cytometry analysis of VISTA expression on various hematopoietic cell types. (C) Total populations of CD4+ and CD8+ T cells from thymus, LN, and spleen or subsets of CD4+ T cells (i.e., Foxp3+ nTreg cells and naive and memory CD4+ T cells) from spleen. (D and E) CD11b+ monocytes and CD11c+ DC subsets from spleen and peritoneal cavity. (F) Splenic B cells, NK cells, and granulocytes. (G) VISTA expression on hematopoietic cells from different tissue sites, including mesenteric LN, peripheral LN, spleen, blood, and peritoneal cavity. Representative data from at least three independent experiments are shown.

