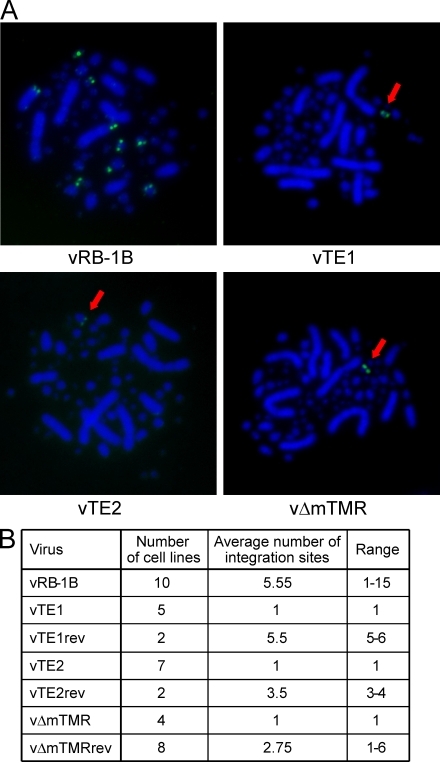
Figure 5.
Integration is severely impaired in the absence of the viral TMRs. (A) FISH analysis detecting MDV integration sites (anti-DIG FITC, green) in metaphase chromosomes (DAPI stain, blue) of representative cell lines of vRB-1B, vTE1, vTE2, and vΔmTMR. In the case of vTE1, vTE2, and vΔTMR, single integration sites are highlighted by arrows. (B) Mean number of integration sites in vRB-1B, mutant, and revertant cell lines. The number of analyzed cell lines and the frequencies of integration events are given. At least eight independent metaphase spread images were evaluated to determine the number of integration sites for each independent cell line.

