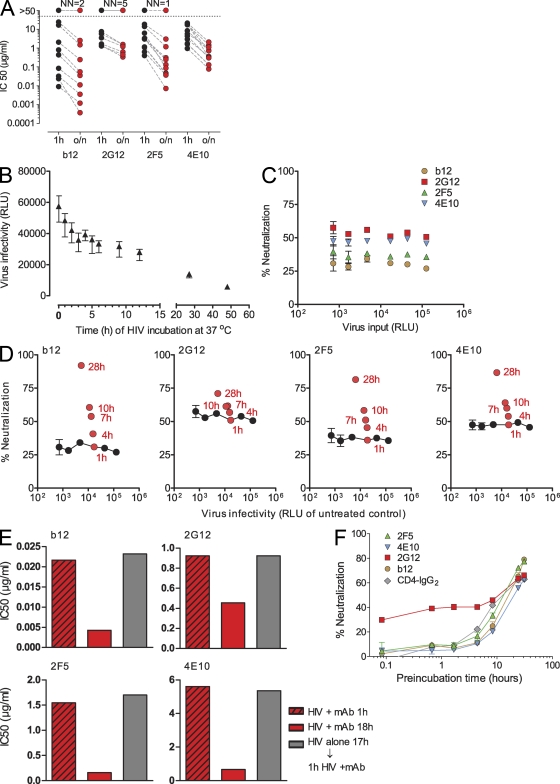
Figure 1.
Kinetics and reversibility of HIV neutralization. (A) Time dependence of neutralization activity was probed by preincubating serial dilutions of mAbs b12, 2G12, 2F5, and 4E10 with 11 different R5 and X4 pseudoviruses (Tables S1 and S2) for 1 h or overnight (o/n; 16–18 h) at 37°C before infection of TZM-bl target cells. The 50% inhibitory concentration (IC50) for each mAb/treatment condition is depicted. IC50 values were derived from sigmoid dose–response curve fits of pooled data of two to three independent experiments. The number of viruses not neutralized (NN) at the highest mAb concentration probed is indicated on top of each antibody panel. (B) Decay of HIV upon long-term exposure to 37°C. A fixed virus input (JR-FL enveloped-pseudotyped virus; 3,000 TCID50/well in culture medium; no mAbs) was incubated for the indicated time periods at 37°C before infection of TZM-bl target cells, and virus infectivity was monitored by luciferase reporter gene production 72 h after infection. Relative light units (RLU) measured per well are depicted. Values are means of 15 replicas, and error bars indicate SEM. One out of five independent experiments is shown. (C) mAb neutralization is constant over a wide range of viral input. Serial dilutions of JR-FL envelope-pseudotyped virus were pretreated for 1 h at 37°C with a fixed concentration of each mAb at concentrations that typically yield neutralization below 70% (0.02 µg/ml mAb b12, 1 µg/ml 2G12, 1.5 µg/ml 2F5, and 7 µg/ml 4E10). In parallel, for each virus dilution, a mock treatment (incubation without mAb) was performed. The viral infectivity of each virus dilution (relative light units of mock-treated sample, measured 72 h after infection) is plotted on the x axis. The y axis indicates the neutralization each antibody achieved at the respective virus input. Error bars indicate SEM. (D) Enhanced mAb neutralization over prolonged incubation is not caused by spontaneous virus decay. In experiments depicted by red symbols, virus input and mAb concentration were kept constant, and only incubation time was varied. In experiments depicted by black symbols, incubation time (1 h) and mAb concentration were kept constant, and only virus input was varied. mAbs were probed at concentrations that typically yield neutralization below 70% (0.02 µg/ml mAb b12, 1 µg/ml 2G12, 1.5 µg/ml 2F5, and 7 µg/ml 4E10). For the red symbols, JR-FL pseudo virus was pretreated with the respective mAbs for the indicated times at 37°C. In parallel, for each time point, a mock control (incubation in medium without mAb) was performed. The viral infectivity measured for the mock treatment is plotted on the x axis for each time point (relative light units, measured 72 h after TZM-bl cell infection). The y axis indicates the neutralization each antibody achieved at after the respective preincubation time. For the black symbols, JR-FL pseudo virus was titrated and preincubated for 1 h at 37°C with the respective mAbs or a mock control (incubation in medium without mAb). The viral infectivity of the mock-treated samples is plotted on the x axis for the respective virus input. The y axis indicates the neutralization activity each antibody achieved at the respective virus input. Data points are means of 20 replicates. Error bars indicate SEM. One of two independent experiments is shown. (E) Increases in inhibitory activity upon prolonged interaction with the virus are a consequence of the antibodies’ action. Envelope-pseudotyped JR-FL was incubated with serial dilutions of b12, 2G12, 2F5, and 4E10 or left untreated for either 1 or 18 h. Alternatively, virus was left untreated for 17 h before being treated for 1 h with neutralizing antibodies. Pretreated virus was then added to TZM-bl cells, and virus infectivity was measured by luciferase reporter gene production 72 h after infection. The 50% inhibitory concentration (IC50) for each mAb/treatment condition is depicted. IC50 values were derived from sigmoid dose–response curve fits of pooled data of three independent experiments. (F) Time of addition experiments were conducted to probe the kinetics of mAb neutralization. Antibody concentrations were chosen to yield neutralization of ∼70% after 20 h of preincubation to allow for the monitoring of increases in neutralization activity over time. 0.03 µg/ml b12, 12 µg/ml 2G12, 2.5 µg/ml 2F5, 8.5 µg/ml 4E10, and 0.1 µg/ml CD4-IgG2 were incubated with JR-FL pseudovirus for the indicated time periods at 37°C. Percent neutralization of virus infectivity on TZM-bl cells was calculated in reference to the respective mock-treated virus control of each time point. One of six independent experiments is shown. Data points depict means and SEM of duplicate measurements.

