Figure 1.
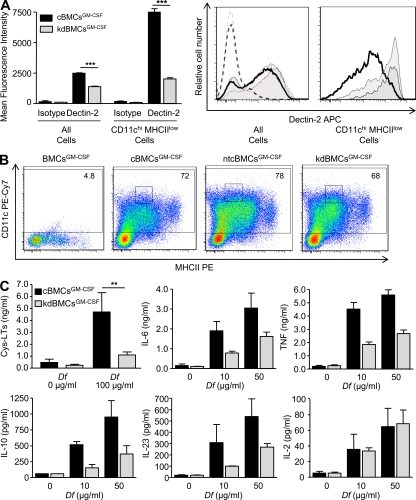
Dectin-2 mediates Df-elicited cytokine production by BMCsGM-CSF. BMCsGM-CSF were infected with viral particles containing Dectin-2 shRNA (kdBMCsGM-CSF), a vector control (cBMCsGM-CSF), or a nontargeting vector control (ntcBMCGM-CSF), selected with puromycin, and harvested at day 7. (A) Dectin-2 expression on all BMCsGM-CSF and on CD11chi MHCIIlow cells was assessed by flow cytometry. Left, results are means ± SEM (n = 4–6 mice per group) from three independent experiments. ***, P = 0.0001. Significance was determined with an unpaired Student’s t test. Right, a representative histogram of Dectin-2 expression on all BMCsGM-CSF and on CD11chiMHCIIlow cells from cBMCsGM-CSF (gray), ntcBMCGM-CSF (light gray), and kdBMCsGM-CSF (heavy black line) cultures is compared. Isotype control staining on all BMCsGM-CSF is also shown for cBMCsGM-CSF (gray dotted), ntcBMCsGM-CSF (light gray dotted), and kdBMCsGM-CSF (heavy black line dotted). (B) Representative histograms are shown of CD11c expression and MHCII expression on cBMCsGM-CSF, ntcBMCsGM-CSF, and kdBMCsGM-CSF, with the percentage of CD11c positive cells noted, as gated by the isotype control staining on a mixture of cBMCsGM-CSF, ntcBMCsGM-CSF, and kdBMCsGM-CSF, designated BMCsGM-CSF. MHCII staining was performed with nonsaturating antibody concentrations. Gating on a CD11chiMHCIIlow Dectin-2hi subset is also indicated (small boxes). (C) BMCsGM-CSF were stimulated with Df at the indicated concentrations and the supernatant contents were assessed by ELISA for cys-LTs at 60 min and for cytokines at 4 h. Results for cys-LT generation are means ± SEM (n = 6–8 mice per group) from four independent experiments. **, P = 0.02. Significance was determined with an unpaired Student’s t test. Results for cytokines are means ± SEM (n = 5–6 mice per group) from three independent experiments. P = 0.01 for IL-6, P = 0.04 for IL-10, P = 0.03 for IL-23, and P = 0.0001 for TNF. Significance was determined with two-way ANOVA (p-values refer to the integrated differences in cBMCsGM-CSF and kdBMCsGM-CSF over the varied doses).

