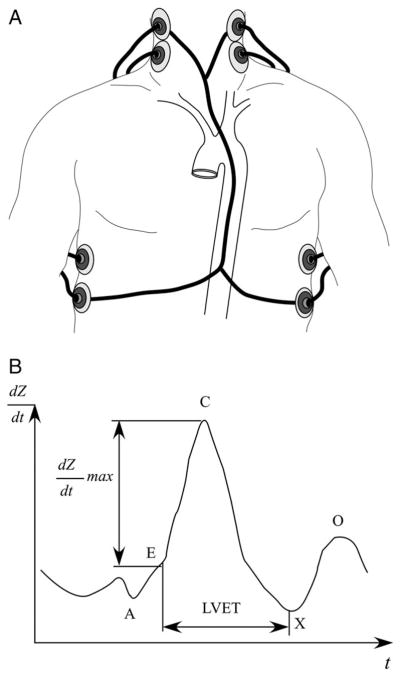
Figure 1.
Band electrode impedance measurement. A, Schematic representation of the band electrode technique. B, Time derivative impedance dZ/dt plotted against time t. Point A marks the fourth heart sound of atrial contraction, point B signals the first heart sound before ventricular isovolumetric contraction and rapid ejection, point C is the maximum dZ/dt, point X is the second heart sound of the closing aortic valve, and point O marks the diastolic filling. Left ventricular ejection time (LVET) is the time between points B and X.

