
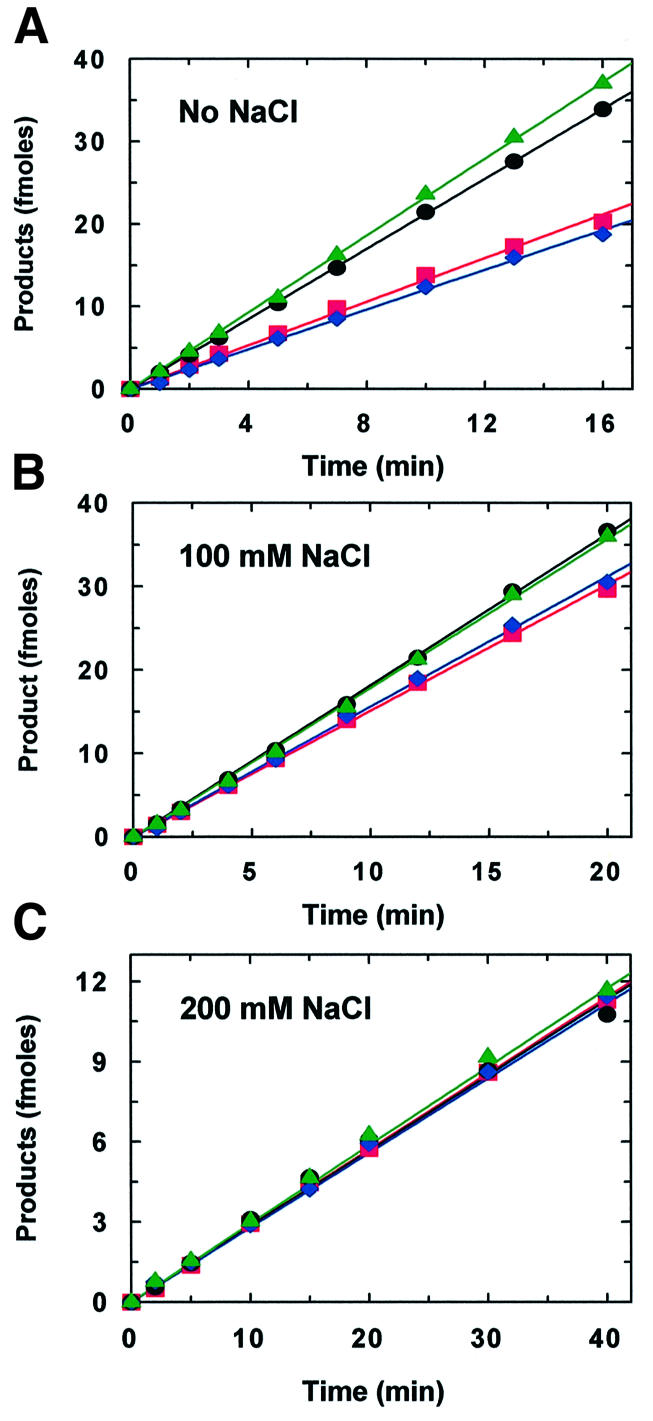
Fig. 4. Salt dependence. Reactions at 37°C contained 500 fmol of N200 (32P-labelled at both ends) and 2.5 fmol of EcoRV in 100 µl of reaction buffer without added NaCl (A), with 100 mM NaCl (B) or with 200 mM NaCl (C). Aliquots were removed from the reactions at various times and analysed as in Figure 3, to determine the amounts of the 32P-labelled products at each time point: product A (120 bp), black circles; product BC (570 bp), blue diamonds; product AB (320 bp), red squares; product C (370 bp), green triangles. The black, blue, red and green lines are the optimal fits to the data for A, BC, AB and C, respectively. Each data point is the mean value from four or more separate experiments; the error bars (not shown) had similar magnitudes to those in Figure 3.