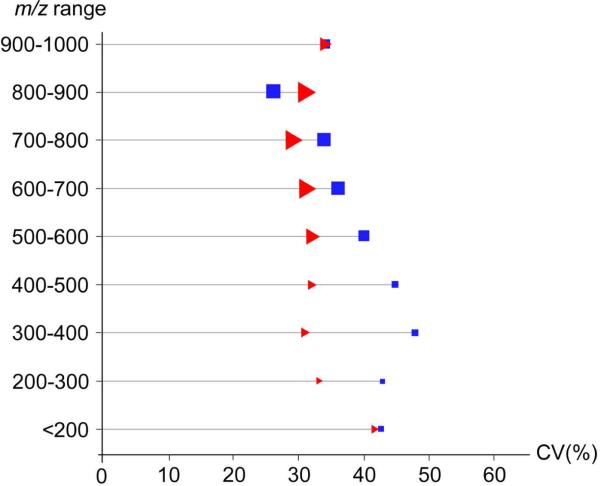
Figure 6.
Plot of the average CV over a range of m/z values for biological replicates of plasma (blue squares) and CSF (red triangles). The total number of features over each range of m/z values is represented by the relative size of the corresponding icon (i.e., larger icons represent m/z ranges for which more features were detected).

