
Figure 3.
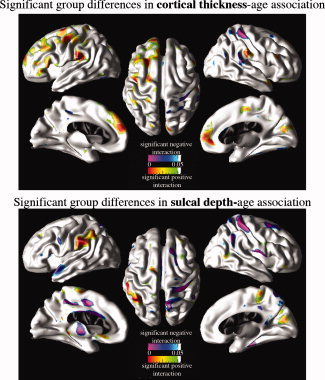
CAE‐related modulation of cortical morphometry‐age associations. Cortical surface P‐value maps show the regional significance of CAE‐related modulation effects on age‐cortical morphometry (i.e., cortical thickness and sulcal depth) associations after removing the partial effects of sex. Hot colors (red and green) imply positive regression coefficients for age‐diagnosis interaction terms in GLM and cold colors (purple and blue) imply negative regression coefficients for age‐diagnosis interaction terms in GLM. [Color figure can be viewed in the online issue, which is available at wileyonlinelibrary.com.]