
Figure 6.
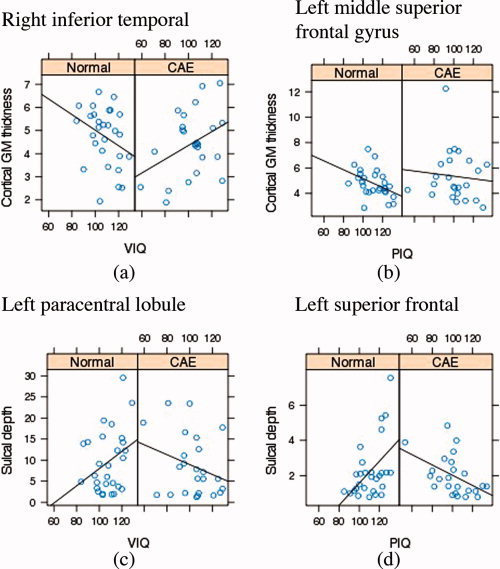
Plots of cortical morphometry (i.e., cortical GM thickness and sulcal depth) as a function of IQ (i.e., VIQ and PIQ) within healthy children and children with CAE groups separately for sample points in (a) right inferior temporal with significant positive CAE‐related modulation effect on cortical thickness‐VIQ association, (b) the left middle frontal with significant positive CAE‐related modulation effect on cortical thickness‐PIQ association, (c) the left parieto‐occipital region with significant negative CAE‐related modulation effect on sulcal depth‐VIQ association, and (d) the left superior temporal with significant negative CAE‐related modulation effect on CAE‐related modulation effect on sulcal depth‐PIQ association. [Color figure can be viewed in the online issue, which is available at wileyonlinelibrary.com.]