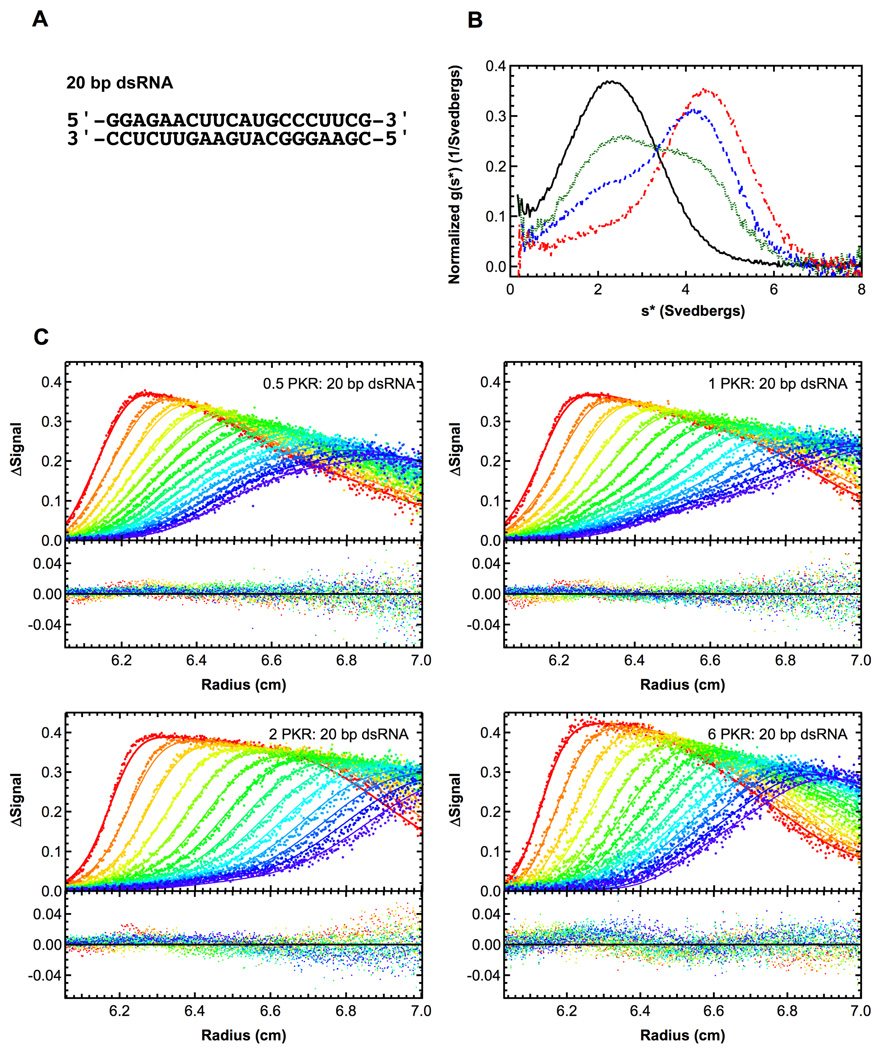
Figure 3.
Sedimentation velocity analysis of PKR binding to a 20 bp dsRNA. A) RNA structure. B) Normalized g(s*) distributions of 1 µM dsRNA (black, solid), dsRNA + 0.5 eq. PKR (green, dot), dsRNA + 1 eq. PKR (blue, dash), dsRNA + 2 eq. PKR (red, dot-dash). The distributions are normalized by area. C) Global analysis of sedimentation velocity difference curves. The data were subtracted in pairs and four data sets at the indicated ratios of PKR: dsRNA were fit to 1:1 binding stoichiometry model. The top panels show the data (points) and fit (solid lines) and the bottom panels show the residuals (points). For clarity, only every 2nd difference curve is shown. Conditions: rotor speed, 50,000 RPM; temperature, 20°C; wavelength, 260 nm.

