
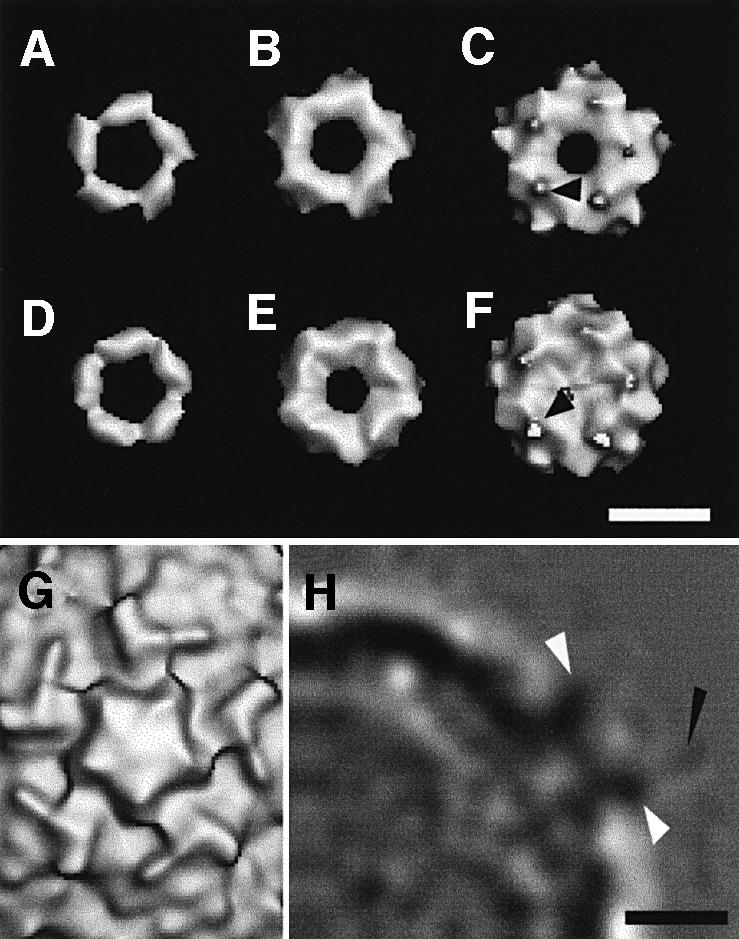
Fig. 3. Difference maps showing V1–3 (A–C) and MBP-V1–3 (D–F), extracted from the maps of the complex with HRV2, are shown for three different thresholds. In both difference maps, a small protuberance is visible at low contour (arrows in C and F). (G) A view, down the 5-fold axis, of the native HRV2 reconstruction at the same scale and orientation for reference. (H) A central section of the HRV2–MBP-V1–3 density map. The weak density attributed to the MBP fusion protein is marked with a black arrow. The density attributed to the receptor is arrowed in white. The scale bars represent 5 nm.