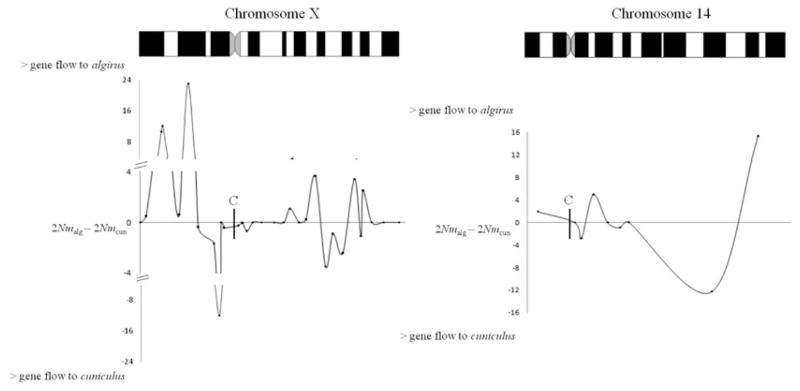
Figure 4.
Plot of the difference between 2Nm values in O. c. algirus and 2Nm values in O. c. cuniculus per locus versus position on chromosomes X and 14. If the resulting value is positive higher gene flow was inferred from O. c. cuniculus to O. c. algirus than in the opposite direction. If the resulting value is negative higher gene flow was inferred from O. c. algirus to O. c. cuniculus than in the opposite direction. Position of the centromere (C) is indicated with a vertical line. Data on four X-linked loci from Geraldes et al. (2006) on a different set of individuals were also included.

