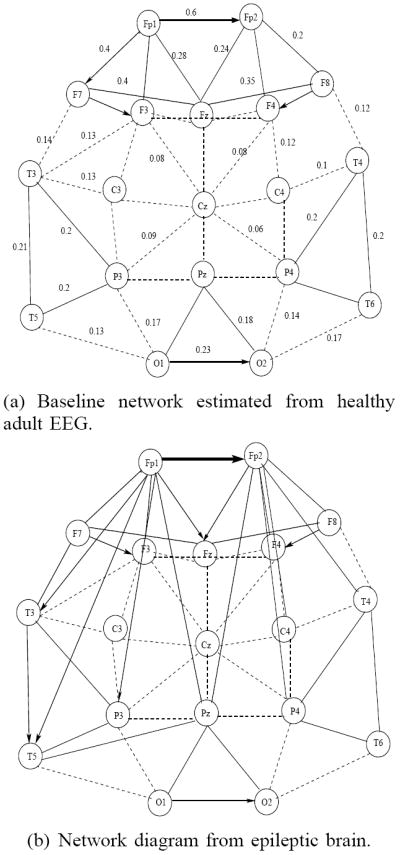
Fig. 5.

Inter-region connectivity network based on estimated coupling strength (in the range 0-1). Thicker lines indicate stronger connections, dashed lines indicate connections with low coupling strength.

Inter-region connectivity network based on estimated coupling strength (in the range 0-1). Thicker lines indicate stronger connections, dashed lines indicate connections with low coupling strength.