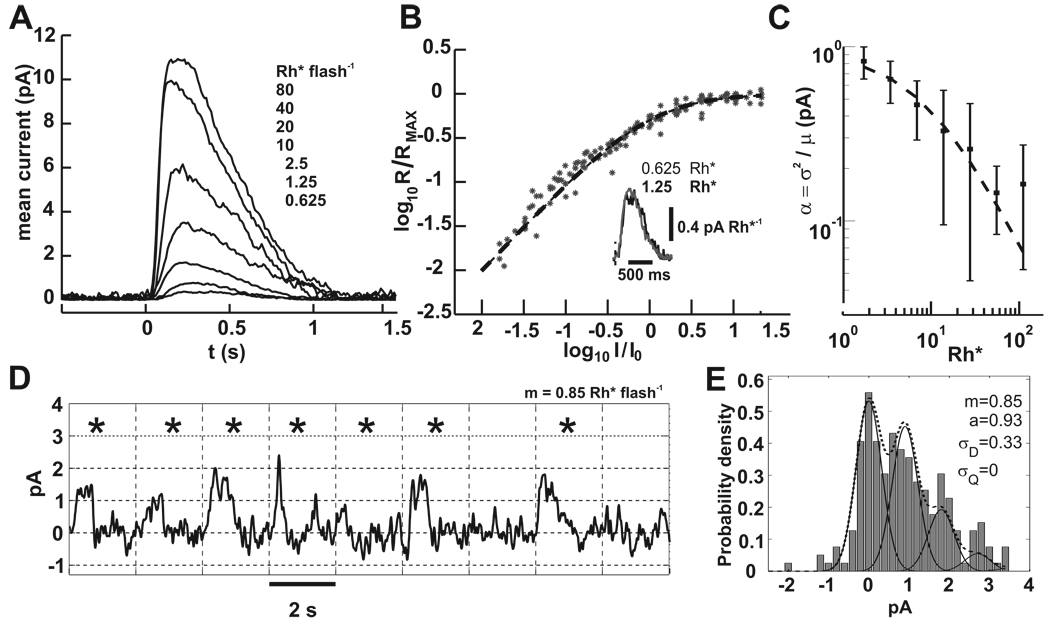
Figure 2. Rod suction electrode recordings demonstrate the noise that obscures the SPR.
A) A family of responses to increasing flash energies. Each trace is the average of 10 to 100 flash presentations. Flashes were delivered at 0.5 s. Dark current for this cell was ~12 pA and the intensity that produced the half maximal response was 17.25 Rh*.
B) Data collected from 15 rods was fit to equation (3). Responses for each rod were normalized to the dark current and scaled by the intensity that produced the half maximal response. Inset: an overlay of the two lowest flash strengths divided by their flash energies shows the similarity in waveform, which is expected for linear summation. Flash onset is indicated by the vertical dashed line.
C) The contribution of each Rh* to the flash response decreases with increasing stimulus strength. Plotted is the ratio of the variance to the mean at the peak of the flash response.. Data from 15 rods was fit to equation (4) with parameters I0 = 8.4 Rh* and a = 0.92 pA.
D) A segment of a 400 s rod suction recording that encompassed 9 flash presentations at 0.5 Hz is shown. Flashes delivered on average 0.85 Rh*, and from Poisson statistics ~40% should have generated no response. Tick marks on the abscissa and vertical grid lines correspond to the flash times. Asterisks mark the flash responses whose correlation with the mean response was > 0.5. From Poisson statistics, singletons and multiples should have occured with probabilities 0.36 and 0.21, respectively. Baseline drift was corrected by fitting and then subtracting a spline to the average current of 100 ms periods in darkness that were spaced 2 s apart. Bandwidth = DC to 5 Hz.
E) The response amplitude histogram of the entire 400 s record in D is shown (200 flashes). No spline subtraction was used. Amplitudes were generated by correlation with a scaled portion of the mean flash response with each trial (Field and Rieke, 2002). The dotted line is the from equation (5), with individual peaks corresponding to 0, 1, 2, and 3 photoisomerizations shown by the solid lines. Only a and σD parameters were allowed to vary. Best fit parameters are shown.

