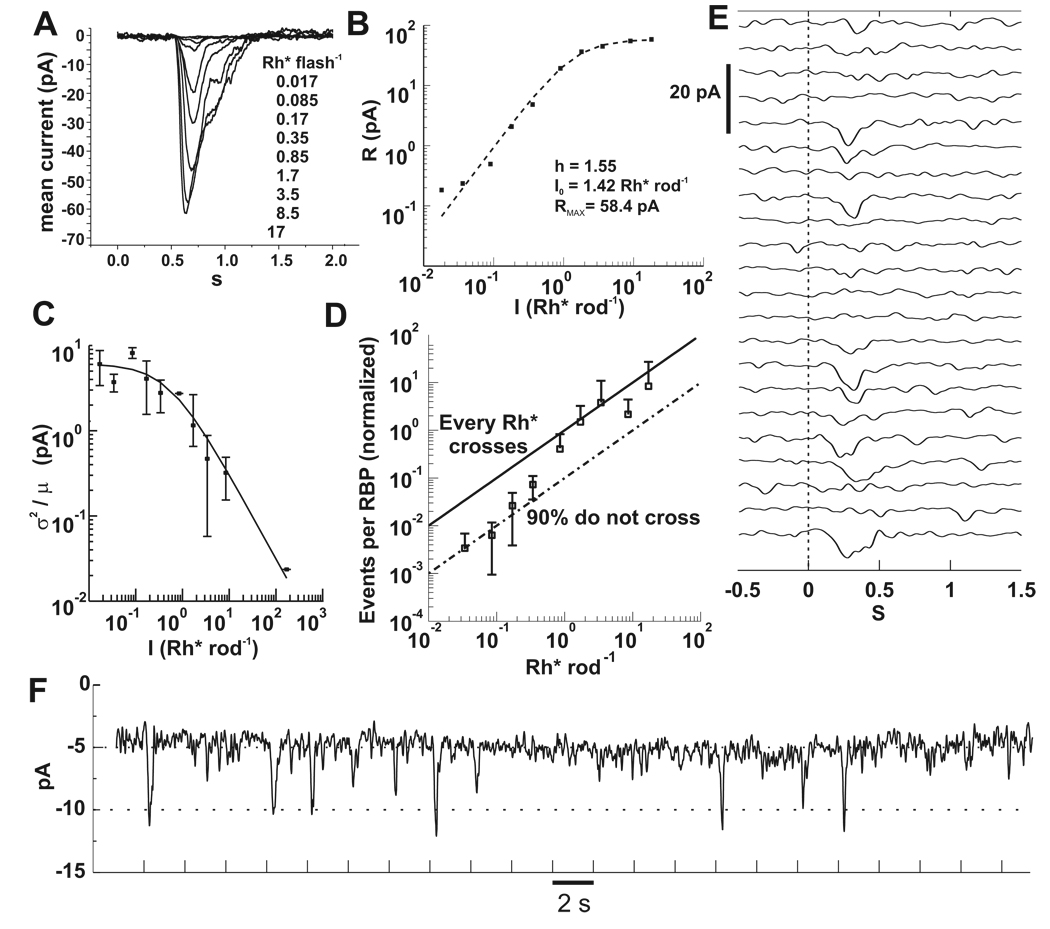
Figure 3. RBP responses depend nonlinearly on flash strength.
A) Baseline subtracted currents recorded from a RBP in the perforated patch configuration. Each trace is an average of 3 to 20 flash presentations. Flashes were delivered at 0.5 s. Vh = −60 mV.
B) Peak currents of A plotted against flash intensity were fitted to equation (3). Best fit parameters are displayed in the plot.
C) The ratio of the ensemble variance to the mean yielded the unitary response amplitude for RBPs (n=12). As flash intensity increases, the current contributed by each Rh* decreases. The solid line is equation (4) with parameters aRBP = 6.1 pA, I0 = 0.52 Rh* rod−1.
D) Rh* events in rods are discarded by RBPs. The number of unitary events in a RBP is given by equation (2). Data from individual cells (n=5) was averaged and scaled so that the points above 1 Rh* were bounded by the upper black line, which marks the input-output relationship corresponding to synaptic transfer of every Rh* in the rods. The lower line was drawn to mark 90% loss due to nonlinear transfer. The transition from 10% to 100% transmission occurs over the range of 0.3 to 2 Rh*, in which the probablility of multiple photon absorptions and the consequent threshold crossings also increases.
E) An example of a RBP response to repeated flashes delivering on average 0.17 Rh* rod−1. Note the low amplitude noise during periods without a stimulus.
F) Same data in E, but the trials are concatenated. The holding current for this cell was 5 pA. Most of the successful responses have amplitude of 5 or 6 pA, as suggested by the fit in C. Tick marks denote flash timing. Bandwidth = DC to 5 Hz for A, E and F.

