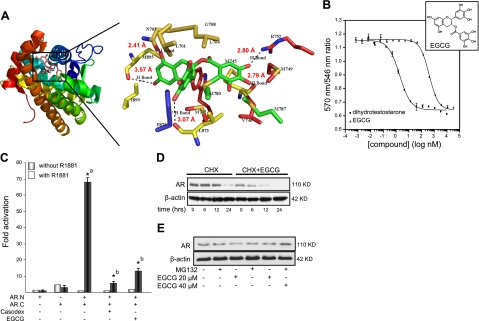
Figure 1.
A) Predicted model for EGCG binding to AR-LBD. Left panel: EGCG binds to AR-LBD in in silico molecular docking studies, using AutoDock software and 2PNU.pdb as the starting receptor. Different domains of the AR are distinguished by color. Right panel: enlarged view of boxed area in left panel, with putative binding sites in the model structure of the AR. Predicted distances of hydrogen bonds (Å) are given next to the bonds. B) EGCG competitively interacts with AR-LBD and decreases its interdomain interaction. EGCG competes with the high-affinity androgen Fluormone AL Red to physically interact with AR-LBD. Data are presented as averages ± se of two sample wells. Inset: structure of EGCG. C) AR N-C-interaction assay was performed in CV1 cells as described in Materials and Methods. Graphs represent fold of hormone induction compared with value for the non-hormone-treated group, which was set as 1. *aP < 0.01 vs. AR.N or AR.C group; *bP < 0.01 vs. AR.N+AR.C group; 1-way ANOVA followed by Tukey's HSD test. D) Effect of EGCG on AR protein turnover in LNCaP cells. Cells were treated with 40 μM EGCG and 50 μg/ml cycloheximide for the indicated time periods. AR protein levels were determined by Western blot analysis with specific antibody against AR and normalized to β-actin as loading control. E) LNCaP cells were exposed to indicated concentrations of EGCG for 48 h with or without 5 μM of MG132. AR protein levels were determined by Western blot analysis with specific antibody against AR and normalized to β-actin as loading control.

