Figure 2.
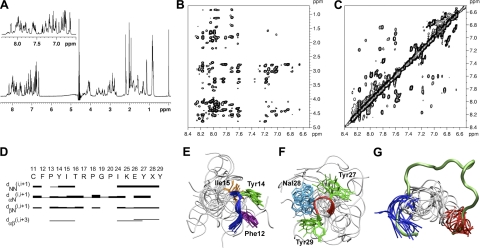
NMR solution structure of peptide R1.5G3. A) 1H NMR spectrum of R1.5G3 in H2O/CD3CN 80:20 (v/v). Inset: amide proton region of the spectrum. B) NOESY contour plot of the amide-aliphatic proton region. C) NOESY contour plot of the amide proton region. D) Summary of sequential and short- and medium-range connectivities for R1.5G3. Thickness of solid bars indicates relative intensity of the NOEs, i.e., weak, medium, and strong. Shaded bars indicate connectivity observed to the CδH of a proline residue in place of the NH. X at position 28 corresponds to 1Nal. E) Ensemble of the 15 NMR solution structures of R1.5G3 with the lowest DYANA target functions after energy minimization. Backbone atom superposition of the Phe12-Ile15 segment over the corresponding residues of full-length RANTES. The backbone of the N-terminal hydrophobic patch is shown as a blue tube; side chains are shown as sticks. F) Backbone atom superposition of the Tyr27-Tyr29 segment over the corresponding residues of full-length RANTES; the backbone of the C-terminal hydrophobic patch is shown as a red tube; side chains are shown as sticks. G) Simultaneous Phe12-Ile15 (blue tube) and Tyr27-Tyr29 (red tube) Cα atom superposition of the 15 NMR solution structures onto the homologous regions of full-length RANTES (11–29 aa stretch of RANTES is shown as a green tube). Figures were generated using Visual Molecular Dynamics (VMD; http://www.ks.uiuc.edu/Research/vmd/).

