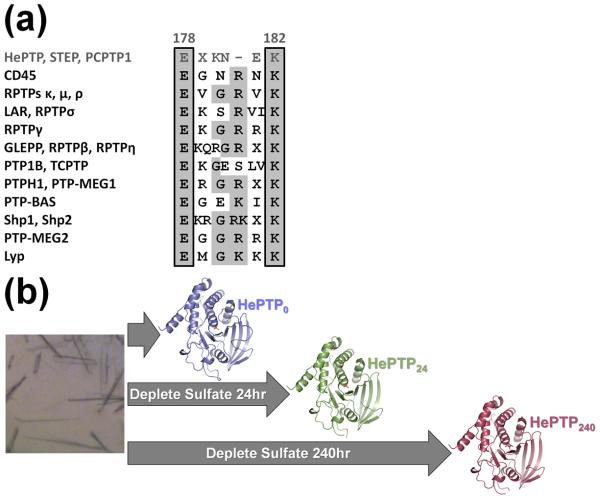
Figure 1.
PTP E loop sequence alignment and schematic of soaking experiments with HePTP crystals. (a) Consensus sequence alignment of 12 human PTP subtypes. Conserved amino acids are shaded in light gray. Members of the KIM-phosphatase family, including HePTP, are in dark gray and the residue numbers above the alignment correspond to HePTP numbering. The 100% conserved E loop glutamate and 80% conserved E loop lysine are boxed. The sequences used for this analysis are described in Andersen et al. (2001).7 (b) Scheme for crystal soaking and data collection. HePTP crystals were grown in 1.7–1.9 M ammonium sulfate (left) and data collected immediately (HePTP0; blue), or soaked in 0.2 M ammonium tartrate for 24 hours (HePTP24; green) or 240 hours (HePTP240; red) prior to data collection. Protein models prepared using PyMOL.36

