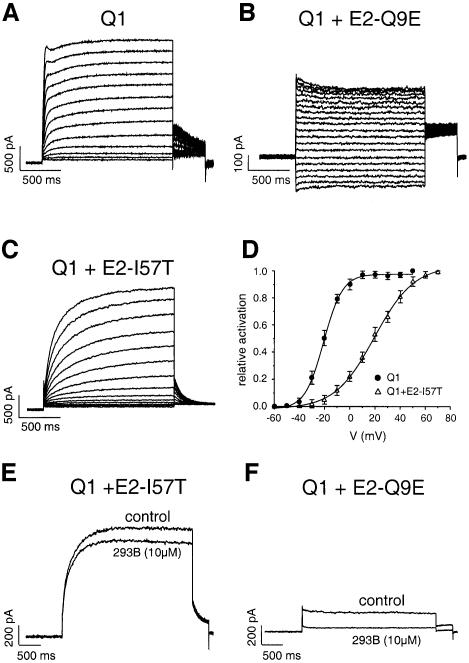
Fig. 4. Modifications of the KCNQ1 current induced by co-expression of mutated KCNE2 subunits. (A, B and C) Traces of currents elicited by 2 s voltage steps from a holding potential of –80 mV over the range of –60 to +60 mV in 10 mV increments for KCNQ1 and KCNQ1–KCNE2-I57T, and over the range –130 to +60 mV in 10 mV increments for KCNQ1–KCNE2-Q9E currents (B). (D) Averaged activation curves for KCNQ1 (filled circle, n = 12) and KCNQ1–KCNE2-I57T (open triangle, n = 9), showing a 40 mV shift towards positive values. (E and F) Influence of the KCNE2-I57T and Q9E mutations on the inhibition by 293B.

An official website of the United States government
Here's how you know
Official websites use .gov
A
.gov website belongs to an official
government organization in the United States.
Secure .gov websites use HTTPS
A lock (
) or https:// means you've safely
connected to the .gov website. Share sensitive
information only on official, secure websites.
