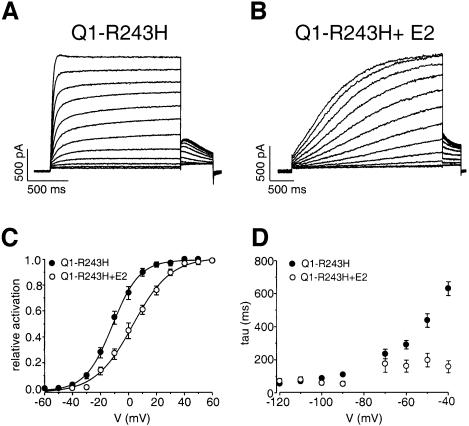
Fig. 5. Slowing down of the activation of the KCNQ1-R243H current (A) by the KCNE2 subunit (B). Currents were recorded from a holding potential of –80 mV over the range of –60 to +50 mV. (C) Averaged activation curves for KCNQ1-R243H in the absence (filled circle; n = 6) or the presence (open circle; n = 9) of KCNE2. (D) Corresponding deactivation time constants fitted to a single exponential function from tail currents elicited from –120 to –40 mV after a test pulse to +30 mV.

An official website of the United States government
Here's how you know
Official websites use .gov
A
.gov website belongs to an official
government organization in the United States.
Secure .gov websites use HTTPS
A lock (
) or https:// means you've safely
connected to the .gov website. Share sensitive
information only on official, secure websites.
