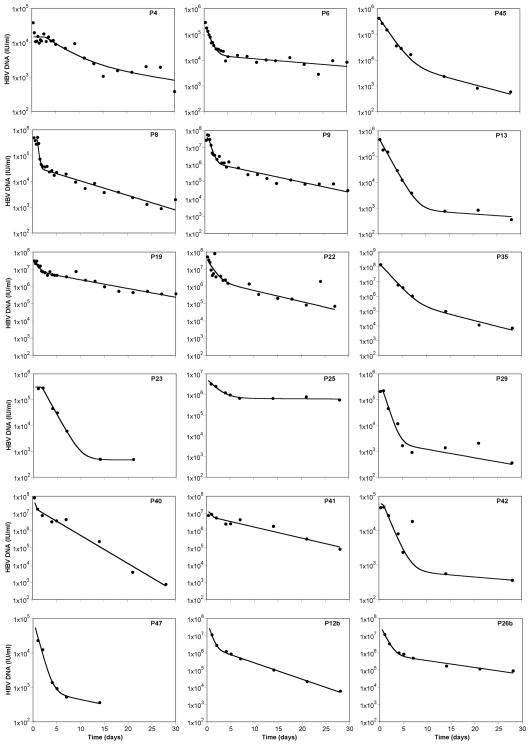
Figure 1.
Representative results of the fit of the model (line) to the HBV DNA level (circles). Each row corresponds to a different treatment protocol (1st row: IFN; 2nd row: LAM; 3rd row: IFN+LAM; 4th row: PEG+LAM; 5th row: PEG; 6th row: ADV+LAM). See methods for full description of fitting procedure.

