
Figure 3.
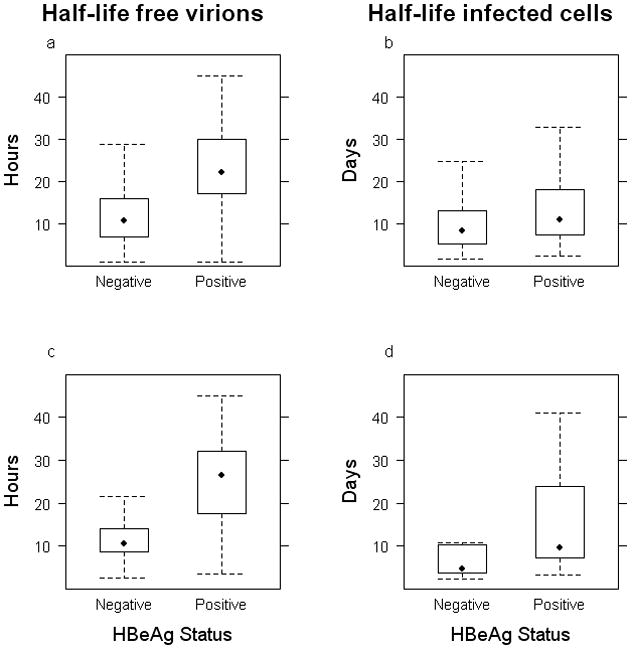
Comparison of the half-lives of free virions and infected cells between infections with HBeAg-negative (Neg) and HBeAg-positive (Pos) HBV strains. a) and b) present the data for all the studies in Table 2, for free virions and infected cells, respectively. c) and d) restrict the data to those studies with similar treatments, frequent early sampling, and models (see text). The bottom and top of the box represents the 25th and 75th percentile of the data, respectively; the whiskers represent 1.5 times the inter-quartile range and give an idea of the range of values in the data; and the symbol inside the box represents the median of the data.