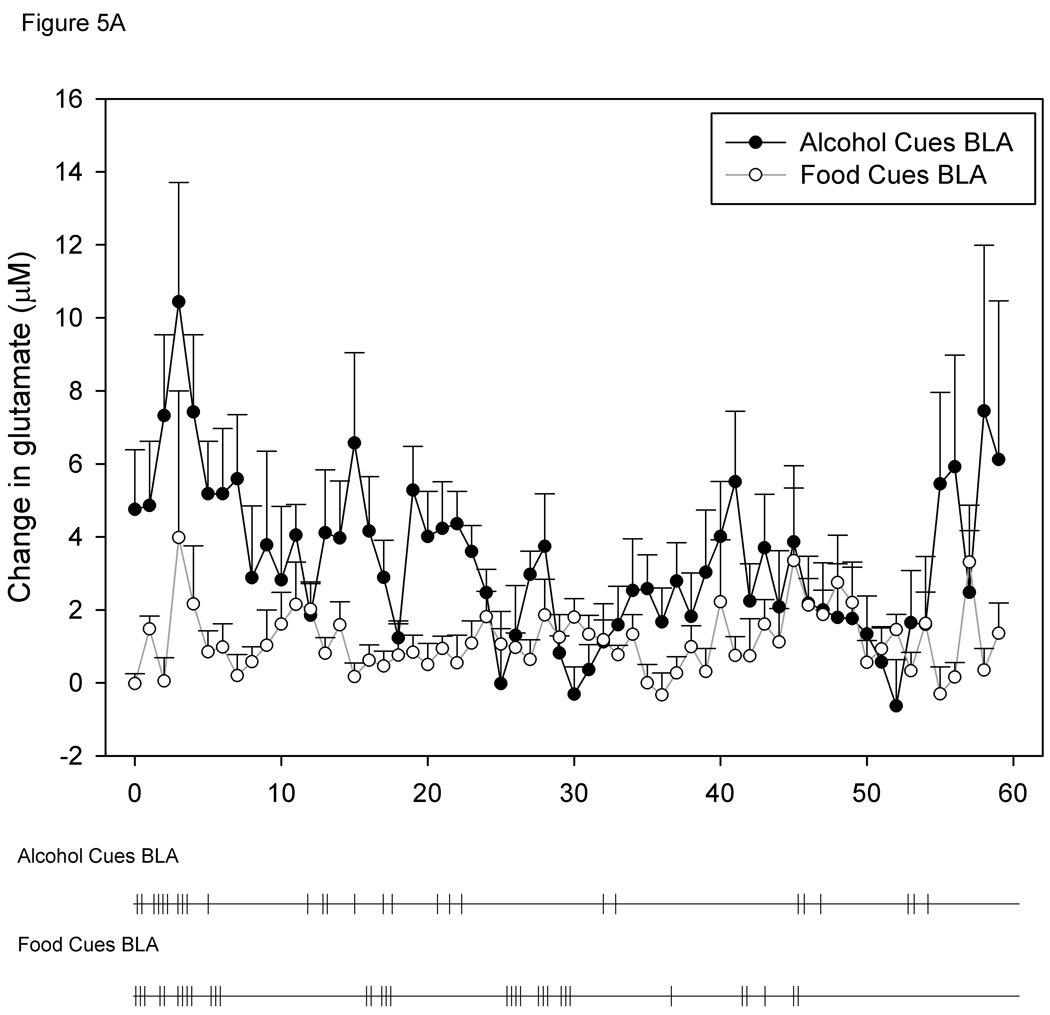
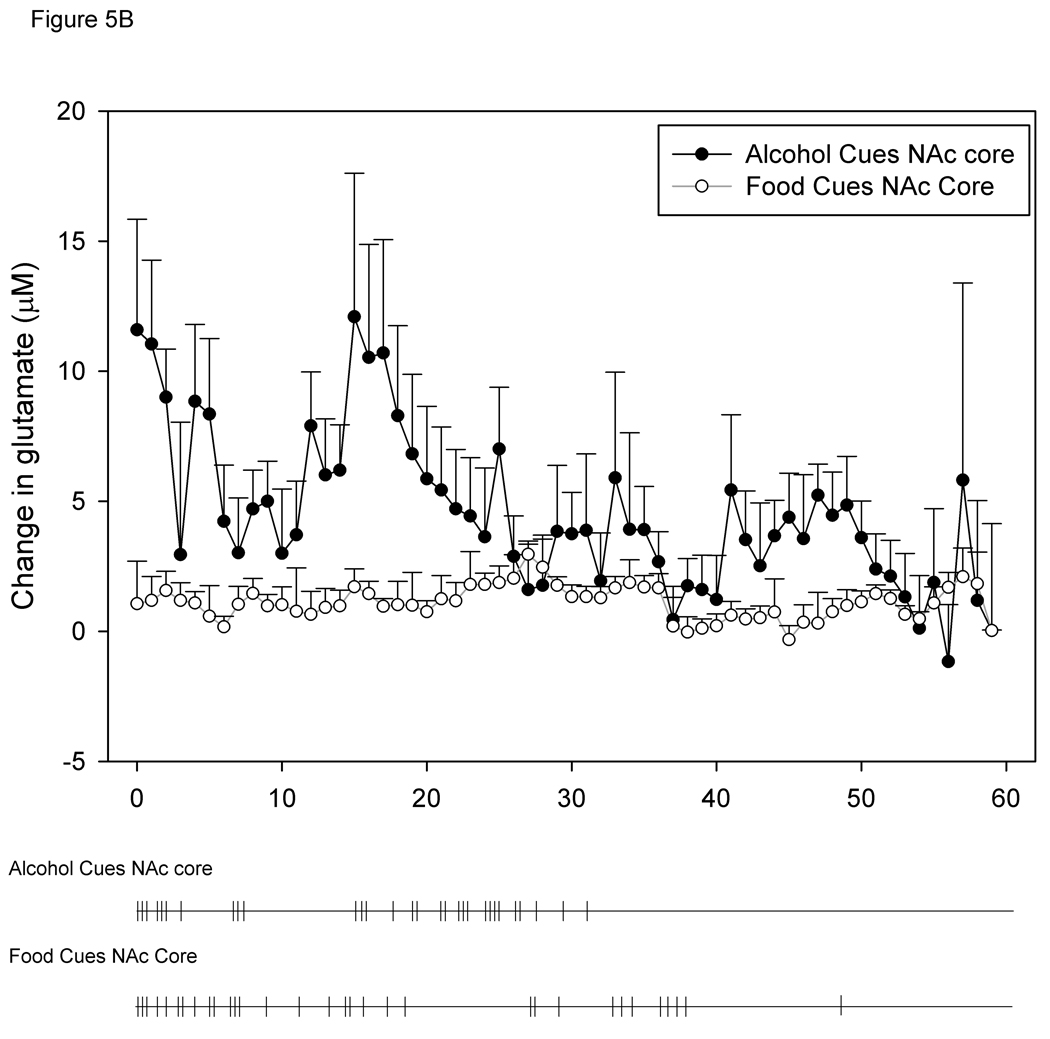
Figure 5.
5A and 5B. Time course of changes in BLA (A) and NAc core (B) extracellular glutamate levels during alcohol- and food-seeking behavior. Below each graph is a time course of active lever pressing behavior from a representative animal from each of the groups. Each tick mark represents one bar press during the reinstatement session.


