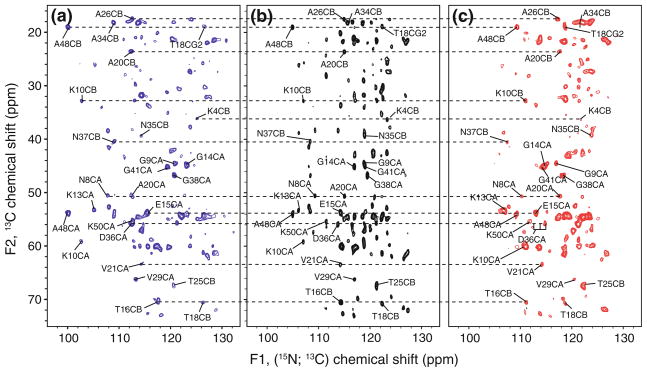
Fig. 2.
(3,2)D (HACA)NCOCX: subspectra comprising signals located at sums (a) and differences (b) of 15N and 13C′ chemcial shifts along F1 are shown on the left and right, respectively, of the central peak spectrum comprising signals at 15N chemical shifts. Positive contours above 6 times the RMS noise floor are drawn for each spectrum with contour separation factor of 1.3. The total measurement time was 87 min (t1 96 × 180 μs; t1′ 96 × 90 μs). As an illustration, selected peaks are labeled and connected. Labels correspond to the destination peak with the source atom consisting of the succeeding residue’s amide 15N and a 13CO component as appropriate. Dashed horizontal lines were added to connect peaks from the same residue

