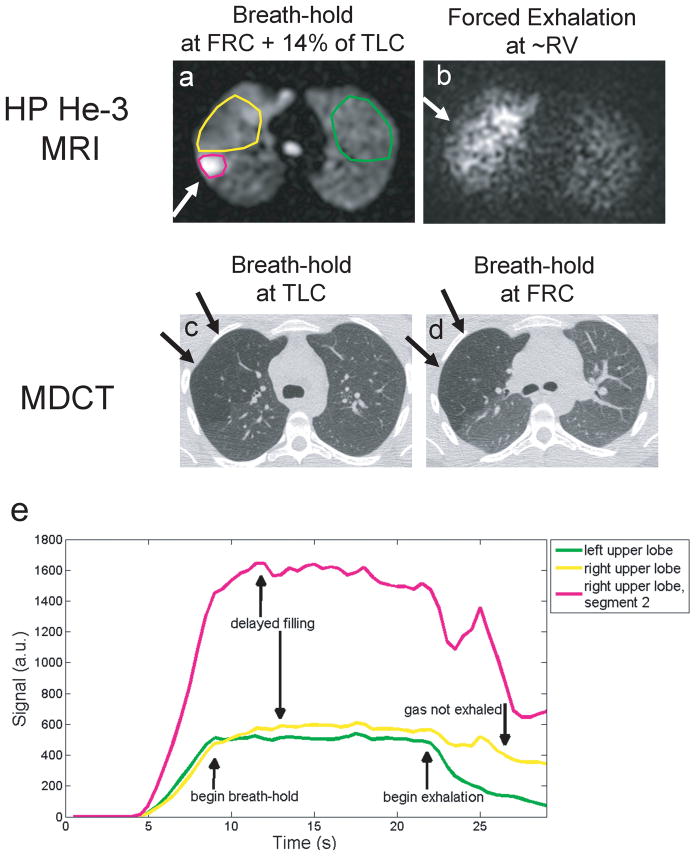
Figure 7.
Results from 3D dynamic MRI in a subclinical finding during inspiration, breath-hold and forced expiration. MRI results in a,b are compared to follow-up MDCT in the same subject in c,d showing hyperlucency in the RUL due to air trapping on MDCT (arrows c,d). Plots of signal time-course for dynamic MRI for the right upper lobe (yellow) compared with left upper lung (green) in the same case. Hyper-intense signal on HP 3He was found to correspond to the 2nd segment that was not blocked by by a pulmonary aneurysm (green). Note delayed filling as evident by the later time-to-peak signal enhancement relative to the expected trapezoidal shaped enhancement curve in the contra-lateral left lung region.

