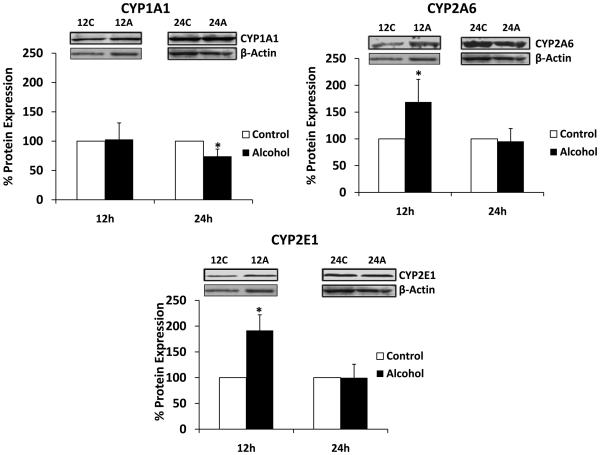
Figure 4. Effect of alcohol on protein expression of CYP1A1, CYP2A6, and CYP2E1.
The protein expression levels were measured using western blot followed by their quantification, which are presented in percent with 100% expression was normalized for the untreated cells at every time point. Expression of each protein was normalized using β-actin. C represents control (untreated samples) and A represents alcohol-treated at respective time in hour. The molecular weight of the proteins are as follows: β-actin (42 kDa), CYP1A1 (54 kDa), CYP2A6 (55 kDa), and CYP2E1 (51 kDa). The quantitative analysis was performed using at least three independent blots from three independent treatments as described in the Materials and Methods section. Alcohol treatment times (h) are presented in X-axis, while % expression is presented in Y-axis. * represents p≤0.05 compared to respective controls.

