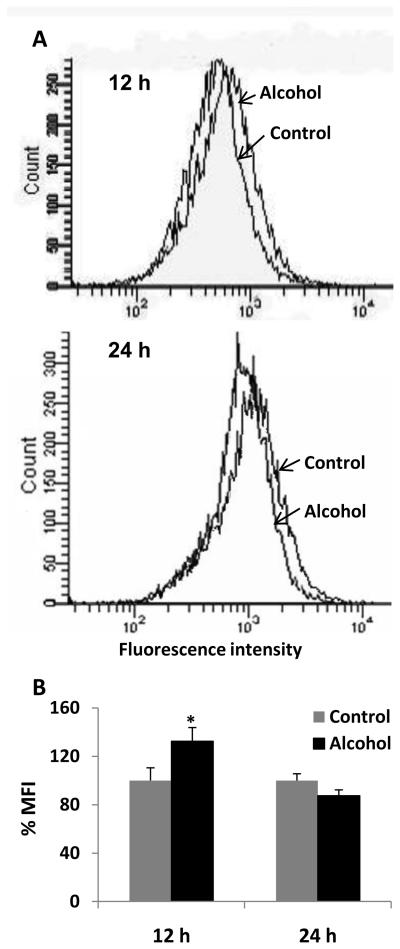
Figure 7. Effect of alcohol on reactive oxygen species (ROS).
A. Representative figures of ROS production. The ROS production was measured using flow cytometer from control and alcohol-treated cells at 12 h and 24 h in U937 macrophages as described in the Materials and Methods section. The events (cell population) are presented in Y-axis and relative fluorescence intensity is presented in X-axis. B. Bar graphs of mean fluorescence intensity. The graphs were plotted as mean ± SD from three independent experiments. The mean fluorescence intensity (MFI) is presented in Y-axis. * represents p≤0.05 compared to controls.

