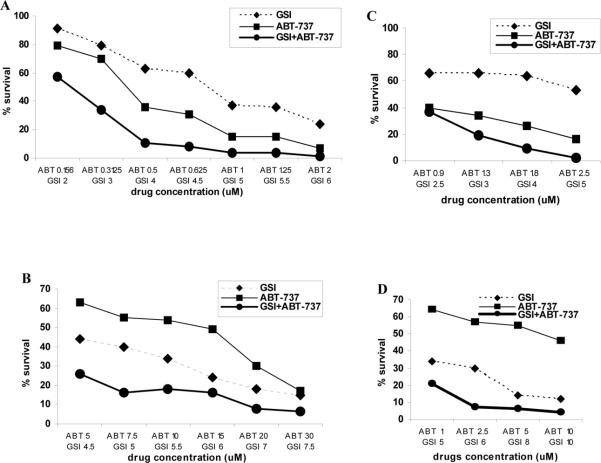
Figure 2. Combined effect of GSI and ABT-737 on the viability of MM cells.
Fifty thousand human MM (A) 8226, (B) U266, or (C) MM1S cells as well as (D) 4x10⁵ primary CD138+ myeloma cells isolated from BM of one patient with MM were plated in quadruplicates per well of 96-well plates and treated with various concentrations of GSI (dotted line), ABT-737 (thin line), or their combination (thick line) for 48 hrs followed by the MTT assay. Cell viability curves are shown. Combination indices (CI) were calculated using CalcuSyn software. For cell lines, at least three independent experiments with the same results were performed.

