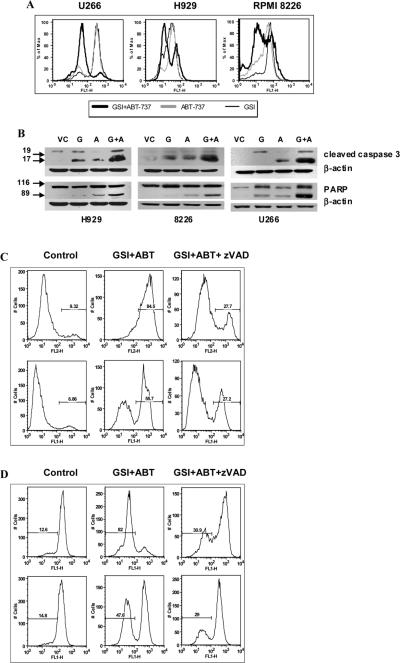
Figure 5. Treatment with z-VAD abrogates the effect of GSI/ABT-737 combination.
(A) MM U266, H929, or RPMI 8226 cells were cultured for 48 hrs with or without GSI, ABT-737, or combination threof. Release of cytochrome c was evaluated by flow cytometry as described in the Methods section. The fraction of cells that retained their mitochondrial cytochrome c appears to be highly fluorescent while cells that lost their cytochrome c emerged as a population of low fluorescent cells. (B) MM cell lines were treated with ABT-737 at either 5 μM (H929 and U266 cells), 0.5 μM (MM1S cells), or 0.2 μM (8226 cells), GSI, or their combination for 48 hrs. Cells were collected and Western blot with antibodies against cleaved caspase 3 and PARP was performed. Equal loading was confirmed by re-probing of the membrane with a beta-actin antibody. (C-D) MM U266 (top panels) or H929 (bottom panels) cells were pre-treated with 100 μM z-VAD-FMK for 2 hrs followed by treatment with 5 μM GSI, 10 μM ABT-737, or their combination. (C) Apoptosis of myeloma cells was detected using an Annexin V binding assay by flow cytometry. (D) Cytochrome c release was detected by flow cytometry using a specific antibody as described in Methods. Indicated are the cells undergoing apoptosis. Experiments were performed twice with similar results.

