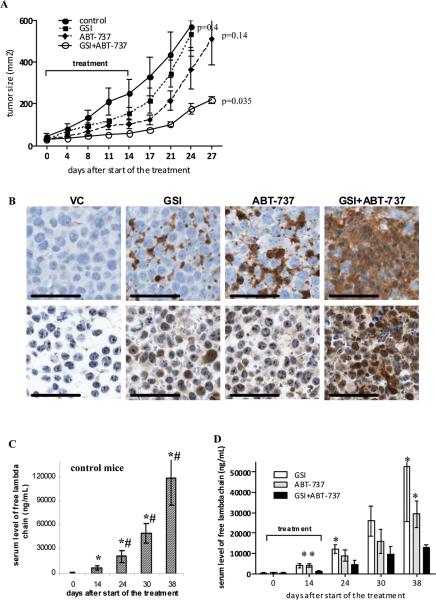
Figure 6. In vivo anti-myeloma effect of combination of GSI with ABT-737.
(A) RPMI-8226 tumors were established s.c. in SCID-beige mice. Mice were split into 4 groups (4 mice per group) with equal size tumors and treated with GSI, ABT-737, or a combination thereof for 14 days. Tumor growth was monitored during and after treatment. Statistical analysis was performed using two-way ANOVA. Shown are statistical differences between treatment groups and vehicle control-treated group. (B) Tumor tissues were collected at the end of the treatment and immunohistochemical staining for cleaved caspase 3 (top row) and Noxa (bottom row) was performed. Representative photomicrographs (×200 magnification) are shown. Scale bars, 50 μM. (C, D) The SCID-hu model was established as described in Methods. Tumor growth was monitored by measuring the level of human paraprotein in mouse sera. Approximately 4 weeks after tumor injection, mice were split into four groups (4-5 mice per group) with an equal average level of free lambda light chain in the sera. Mice were treated with GSI, ABT-737, or a combination of GSI with ABT-737 for 14 days. Please note the different scale for non-treated control group (C) and treated groups of mice (D). Two-way ANOVA and nonparametric Mann-Whitney test were used to determine differences between treatment groups. * - statistically significant (p<0.05) difference between indicated group and GSI+ABT-737 group. # - statistically significant (p<0.05) difference between indicated group and ABT-737 group.

