

Abstract
Backgrounds
Nursing workload is increasingly thought to contribute to both nurses’ quality of working life and quality/safety of care. Prior studies lack a coherent model for conceptualizing and measuring the effects of workload in health care. In contrast, we conceptualized a human factors model for workload specifying workload at three distinct levels of analysis and having multiple nurse and patient outcomes.
Methods
To test this model, we analyzed results from a cross-sectional survey of a volunteer sample of nurses in six units of two academic tertiary care pediatric hospitals.
Results
Workload measures were generally correlated with outcomes of interest. A multivariate structural model revealed that: the unit-level measure of staffing adequacy was significantly related to job dissatisfaction (path loading = .31) and burnout (path loading = .45); the task-level measure of mental workload related to interruptions, divided attention, and being rushed was associated with burnout (path loading = .25) and medication error likelihood (path loading = 1.04). Job-level workload was not uniquely and significantly associated with any outcomes.
Discussion
The human factors engineering model of nursing workload was supported by data from two pediatric hospitals. The findings provided a novel insight into specific ways that different types of workload could affect nurse and patient outcomes. These findings suggest further research and yield a number of human factors design suggestions.
Keywords: workload, mental workload, patient safety, medication error, quality of working life
INTRODUCTION
Quality of care and quality of working life in health care are oft-cited targets for improvement.1–5 Substantive improvements in both can be achieved by combining a thorough understanding of the health care work system with human factors design and redesign.6–13 Excessive nursing workload is among the many work system contributors to quality of care and working life problems that has been internationally recognized as needing further study and remediation.14–21
Aiken’s seminal study reported that workload affected patient safety and nurses’ well being,21 findings corroborated by studies in the U.S.22–29 and abroad,30–37 and supported by anecdotal experiences.38–42 Despite increasing interest in nursing workload, much work remains to be done in the conceptualization and measurement of nursing workload, its causes, and its effects.19 43 44
Reviews of nursing workload measurement16 44–47 show that workload is most often defined in terms of staffing ratios. However, staffing ratios are not clearly representative of nurses’ actual or perceived workload.47 48 Furthermore, occupational workload research suggests that staffing ratios measure only one type of workload43 49 (Figure 1). Generally, workload can be thought of as the ratio of demands (“task load”) to available resources.50 At one level of analysis, patient-to-nurse ratios might be a good representation of workload. However, there are other levels at which demands and resources interact to produce workload.8 29 43
Figure 1.
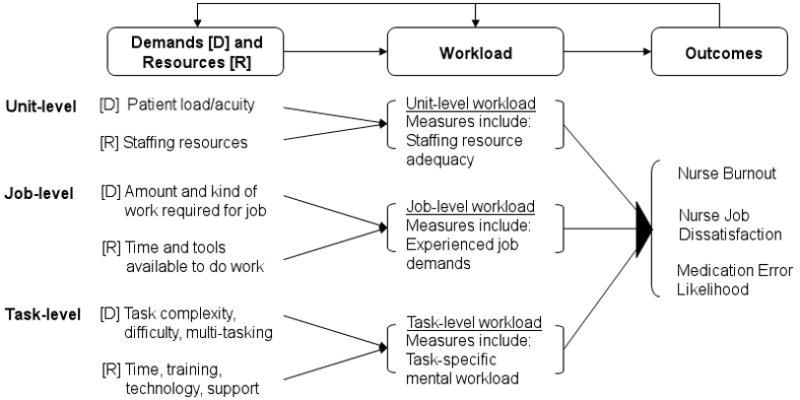
A multi-level human factors framework of nursing workload.
Based on the human factors models of Carayon and Gürses43 and Karsh et al.,8 we propose that at least three types of workload exist, resulting from different demands and resources (see Figure 1). Unit-level workload refers to the staffing ratios mentioned above. Job-level workload51 52 refers to general and specific demands of the job, including the general amount of work to be done in the day, the difficulty of the work, and the amount of concentration or attention required to do it. Resources at this level include time given to complete work, rest breaks, and available human (e.g., unlicensed assistive personnel) or technological resources. Task-level workload53–55 refers to the demands and resources for a specific nursing task, such as medication administration. Demands might include the need to concentrate or multitask, while resources include training, cognitive capacity, technologies, staff support and more.
Each type of workload is measured in a distinct manner and each might have a different impact on outcomes such as quality of care, patient safety, nurse behavior, or nurse job dissatisfaction and burnout. Importantly, each type can be addressed through distinct approaches to policy change, training/education, and systems design.
The objectives of the current study were to (1) measure each of the three types of workload experienced by nurses at two pediatric hospitals, and (2) assess whether and which measures of workload were related to three important outcomes: nurses’ self-reported job dissatisfaction and burnout, and the perceived likelihood of an error occurring during medication administration. It was expected that some, but not other, types of workload would be associated with each of the outcomes.
METHODS
Study design
The study is based on cross-sectional survey data collected from registered nurses at two urban academic tertiary care free-standing pediatric hospitals. The study was approved by both hospitals’ IRBs.
Sample and setting
Hospital A, in the Midwest, had 222 beds. Hospital B, in the South, had 162 beds. In each hospital, 3 inpatient units were studied: pediatric intensive care (PICU), hematology-oncology-transplant (HOT), and general medical/surgical (MED). Hospital A had a 24-bed PICU, 24-bed HOT unit, and 48-bed general medical/surgical unit. In Hospital B, each unit had 24 beds.
Full-time registered nurses (24 hours per week or more) in the study units were eligible to participate. Temporary nurses, float nurses, or nurses who did not directly provide patient care were not included in the target sample, leaving 203 and 144 eligible nurses from Hospitals A and B, respectively.
Measures
All items underwent extensive evaluation procedures56–60 including cognitive interviewing with non-study nurses.61–65 Survey items were measured on 7-point Likert-type scales ranging from 0 to 6, with the category labels “not at all,” “a little,” “some,” “a moderate amount,” “pretty much,” “quite a lot,” and “a great deal,” and an option to mark “don’t know.” Participants were instructed to think of the past 30 days.
Workload and outcome measures are described in Table 1. Both general and specific measures of job-level workload were obtained, the latter focusing on attention demands of the job and comprised of two highly-intercorrelated subscales that were combined to form a single variable (results were nearly identical using the subscales separately). The two task-level workload scales were developed by the researchers based on the two most valid subjective task workload measures, the NASA-TLX53 and SWAT.54 Using separate internal and external task-level workload scales was a post-hoc decision based on a poor fit between the data and a one-factor confirmatory model; exploratory factor analysis strongly suggested a two-factor solution. The task of interest was medication administration because of the importance of this task to nursing care and patient safety.66 67 Indeed, on a scale of 0 to 6, these same nurses reported that, compared to all nursing interventions, this task had an impact of 5.2 (SD = 1.0) on patient outcomes.
Table 1.
Measures used, internal consistency, and examples
| Construct | Measure | Items | α* | Example item |
|---|---|---|---|---|
| Unit-level workload | Staffing/resource adequacy scale68† | 4 | .86 | To what extent is there enough staff to get the work done? |
| Job-level workload (General) | Job demands scale51 | 3 | .66 | To what extent does your job require a great deal of work to be done? |
| Job-level workload(Specific) | Monitoring demands and production responsibility subscales69 | 8‡ | .82 | To what extent does your work need your undivided attention? (monitoring demands) To what extent could a lapse of attention cause an adverse outcome to a patient? (production responsibility) |
| Task-level workload (Internal) | Medication administration concentration and effort53 54 | 2 | .70 | To what extent does the overall medication administration process require concentration, starting with when medications are retrieved and ending with administration and documentation? |
| Task-level workload (External) | Medication administration interruptions, divided attention, and rushing53 54 | 3 | .67 | To what extent are there interruptions during the overall medication administration process, starting with when medications are retrieved and ending with administration and documentation? |
| Job dissatisfaction | Job satisfaction/dissatisfaction scale70 | 3 | .83 | In general, to what extent do you not like your job? |
| Burnout | Emotional exhaustion subscale of burnout inventory71 | 4 | .86 | To what extent do you feel emotionally drained from your work? |
| Medication error | Perceived likelihood of medication error | 1 | - | In actual practice, how likely is an error to occur through the overall medication administration process, starting with when medications are retrieved and ending with administration and documentation? |
Cronbach’s alpha
This scale was reverse-scored, such that lower staffing/resource adequacy scores reflected higher unit-level workload
A combination of two 4-item subscales
Survey administration
Eligible nurses were informed about the study and hand-delivered surveys packets during inservices, staff meetings, or shift-change meetings. Each survey packet was individually labeled with a nurse’s name and a unique ID; each contained a personalized cover letter, survey, informational sheet/consent form, stamped reply envelope, and $5USD cash incentive. Nurses were instructed to complete the survey on their own time. Reminder postcards were placed in nurse mailboxes after one week, followed by a new survey packet 7–10 days after, and another reminder postcard 7–10 days after that. Data were collected November–December 2005 and March–May 2006 at Hospital A and B, respectively.
Analysis plan
A multilevel logit model72 was constructed, as depicted in Figure 2, and path loadings were assessed. Exogenous variables were measures of unit-level, general job-level, specific job-level, task-level internal, and task-level external workload. Endogenous variables were job dissatisfaction, burnout, and medication error likelihood. The path loadings between the three outcome variables were estimated. The model was constructed using the MPlus software (Muthén & Muthén, Inc., Los Angeles, CA). Parameter estimated standard errors took into account non-independence of observations due to the cluster sampling within units.73 Statistical adjustment was made for hospital, unit, shift, number of hours worked per week, experience (total time with current employer), and age. Due to a lack of variation in gender, ethnicity, and education, those variables were not adjusted for. Adding covariates did not change the pattern of results or any outcomes of significance tests. Thus, only statistical values adjusted for covarites are reported. An a priori alpha criterion of .05 was used. Where noted, reported correlations were adjusted using the False Discovery Rate (FDR) approach to counteract the increased chance of Type I error with multiple statistical assessments.74–76
Figure 2.
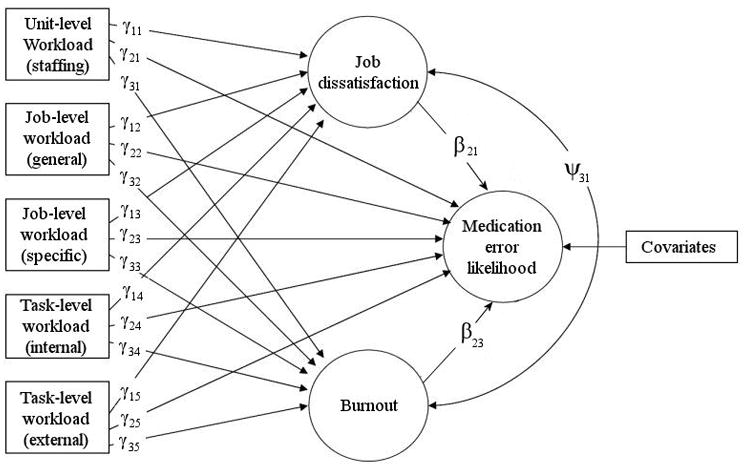
Multilevel logit model. Arrows depict tested path loadings between workload, nurse outcomes, and patient outcomes.
RESULTS
The overall response rate was 57.3%. Table 2 provides sample characteristics. Compared to nurses in the 2004 U.S. National Sample Survey of Registered Nurses (NSSRN),77 nurses in our sample were a little more likely to be female (NNSRN = 93.8% female), more likely to be White (NNSRN = 81.2%), younger (NNSRN average = 45.4 years), and worked fewer hours (NNSRN = 43.7). These discrepancies are not unexpected, as in the national sample, 56.2% of nurses worked in hospitals and only 6.5% worked full-time with pediatric patients, and hospital nurses tended to differ from others.77
Table 2.
Response rates and sample characteristics for both hospitals
| Hospital A | Hospital B | |
|---|---|---|
| Response rate (%)o | ||
| Total | 121 (59.6) | 78 (54.2) |
| PICU | 32 (58.2) | 38 (60.3) |
| HOT | 23 (51.1) | 23 (53.5) |
| GEN | 66 (64.1) | 15 (39.5) |
| Demographic characteristics of the analyzed sample of 176 respondents, after ineligible cases were excluded | ||
| Gender, % female | 97.0 | 96.1 |
| Race, % white, not Hispanic | 97.0 | 94.8 |
| Education, % completing college | 93.9 | 97.4 |
| Age (%) | ||
| 18–29 | 35.4 | 55.8 |
| 30–39 | 31.3 | 20.8 |
| 40–49 | 22.2 | 15.6 |
| 50+ | 11.1 | 7.8 |
| Shift (%)* | ||
| Day | 43.4 | 44.2 |
| Evening/afternoon | 12.1 | 2.6 |
| Night | 34.3 | 36.4 |
| Other (e.g. weekends) | 10.1 | 16.9 |
| Hours/week, Mean (SD)** | 32.9 (6.4) | 37.3 (6.9) |
| Years in job, Mean (SD)** | 8.6 (7.8) | 4.5 (5.7) |
| Years on unit, Mean (SD)** | 8.0 (7.5) | 3.9 (5.4) |
| Years with employer, Mean (SD)** | 8.9 (7.8) | 4.8 (5.9) |
| Years in occupation, Mean (SD)** | 11.5 (9.5) | 7.8 (8.0) |
For two respondents from Hospital B, we could not identify which of the three units they worked on. They are included in the analyses and the total response rate, but not in the individual unit response rate
Hospital A differed from Hospital B, p ≤ 0.05 (Pearson chi-square)
Hospital A differed from Hospital B, p ≤ 0.01 (t-test, equal variances not assumed)
For the present analyses, 12 cases were excluded due to missing data on key variables. An additional 11 respondents reported working fewer than 24 hours per week, and were excluded, although including their data did not change the results of the analyses. The final analyzed sample was 176: 99 from Hospital A, 77 from Hospital B.
Table 3 reports descriptive statistics. Self-reported medication error likelihood was assessed with a single item, and the left-skewed (Skewness = .67) distribution of responses on this item suggested dichotomizing the variable as follows: responses reporting the likelihood of a medication error to be “not at all” (n = 9), “a little” (n = 59), or “some” (n = 59), were recoded as “Low error likelihood;” responses reporting the likelihood to be “a moderate amount” (n = 42), “pretty much” (n = 3), “quite a lot” (n = 3), or “a great deal” (n = 1), were recoded as “Moderate error likelihood.” (Results did not change when medication errors were analyzed as a continuous variable.)
Table 3.
Descriptive statistics, Pearson correlations, and odds ratios
| Variable | Unit WL (Staffing) | Job WL (General) | Job WL (Specific) | Task WL | Job Dis-satisfaction | Burnout | Medication Error | |
|---|---|---|---|---|---|---|---|---|
| (Internal) | (External) | |||||||
| Unit WL | ||||||||
| Job WL (Gen) | .40** | |||||||
| Job WL (Spec) | .10 | .30** | ||||||
| Task WL (Int) | −.10 | .27** | .16 | |||||
| Task WL (Ext) | .34** | .44** | .21* | .18* | ||||
| Job Dissat. | .40** | .20* | .06 | −.06 | .23** | |||
| Burnout | .45** | .37** | .20* | .10 | .39** | .63** | ||
| Med Error (Odds Ratio) | 1.37 | 1.92* | 1.13 | 1.21 | 2.47** | 1.06 | 1.10 | |
| M | 2.58 | 4.36 | 5.14 | 4.55 | 3.51 | 1.30 | 2.87 | 1.91† |
| SD | 1.00 | .79 | .72 | .96 | 1.08 | .92 | 1.34 | 1.04 |
P < .05;
P < .01. P-values adjusted using the False Discovery Rate (FDR) adjustment for multiple tests.
A mean is reported here, but medication error was dichotomized for the purpose of all analyses (see text).
Table 3 also reports FDR-adjusted Pearson correlations. Workload measures were positively intercorrelated across levels. Job dissatisfaction and burnout were significantly correlated, but neither was significantly associated with the likelihood of medication error. The bivariate correlations between workload and outcome measures demonstrate fairly consistent relationships between the two.
Table 4 summarizes results from a test of the statistical model in Figure 2. Results show a positive relationship between external mental workload and medication error likelihood (γ25 = 1.04, 95% CI [.78 to 1.30]), with a corresponding odds ratio (OR) of 2.82 (95% CI [2.17 to 3.67]). There was a significant effect of Hospital on medication error likelihood (OR = .58; 95% CI [.37 to .93]), such that Hospital B nurses were almost half as likely to report a moderate-or-higher error likelihood, and of unit (OR = 1.93; 95% CI [1.04 to 3.58]), such that PICU nurses were nearly twice as likely to report a moderate-or-higher error likelihood, compared to nurses in other units.
Table 4.
Results of model test
| Parameter (see Fig 2) | Un-standardized Parameter Estimates* | 95% CI | Odds Ratio | 95% CI | |||
|---|---|---|---|---|---|---|---|
| Lower bound | Upper bound | Lower bound | Upper bound | ||||
| Medication errors | |||||||
| Unit-level (Staffing) | γ21 | .23 | −.24 | .70 | 1.26 | .78 | 2.02 |
| Job-level (General) | γ22 | .17 | −.39 | .73 | 1.18 | .68 | 2.07 |
| Job-level (Specific) | γ23 | −.24 | −.77 | .29 | .79 | .47 | 1.33 |
| Task-level (Internal) | γ24 | .15 | −.33 | .64 | 1.17 | .72 | 1.89 |
| Task-level (External) | γ25 | 1.04 | .78 | 1.30 | 2.82 | 2.17 | 3.67 |
| Dissatisfaction | β21 | −.15 | −.54 | .24 | 0.86 | .59 | 1.27 |
| Burnout | β23 | −.23 | −.66 | .20 | 0.80 | .52 | 1.22 |
| Dissatisfaction | |||||||
| Unit-level (Staffing) | γ11 | .31 | .18 | .45 | |||
| Job-level (General) | γ12 | .04 | −.09 | .17 | |||
| Job-level (Specific) | γ13 | −.00 | −.11 | .11 | |||
| Task-level (Internal) | γ14 | −.05 | −.23 | .14 | |||
| Task-level (External) | γ15 | .09 | −.06 | .24 | |||
| Burnout | ψ31 | .52 | .42 | .63 | |||
| Burnout | |||||||
| Unit-level (Staffing) | γ31 | .45 | .24 | .66 | |||
| Job-level (General) | γ32 | .18 | −.13 | .48 | |||
| Job-level (Specific) | γ33 | .16 | −.04 | .36 | |||
| Task-level (Internal) | γ34 | .07 | −.14 | .29 | |||
| Task-level (External) | γ35 | .25 | .07 | .44 | |||
Italics indicate statistical significance at the P < .05 level.
Parameters are partial regression coefficients, except ψ31, which is a covariance.
Dissatisfaction was positively associated with the unit-level workload measure of staffing adequacy (γ11 = .31, 95% CI [.18 to .45]). Burnout was positively associated with both unit-level staffing (γ31 = .45, 95% CI [.24 to .66]) and task-level external mental workload (γ35 = .25, 95% CI [.07 to .44]). Dissatisfaction and burnout were also positively associated (ψ31 = .52, 95% CI [.42 to .63]). All remaining relationships were non-significant. The findings described above were identical to multiple linear and logistic regression equations carried out separately for the three dependent variables (not reported here).
DISCUSSION
This study set out to test the workload-outcome relationships suggested by the multiple-level model in Figure 1. The findings provide an understanding of how these relationships may play out: medication errors may be best predicted by task-level workload; dissatisfaction by unit-level workload; and burnout by both unit- and task-level workload.
Representing multiple types of workload jointly as we did here has implications for interpretation and design. Previous studies have demonstrated a relationship between quality/safety outcomes and a single measure of workload such as staffing ratios, just as in Table 3. A designer might surmise from any significant value from Table 3 that a design intervention addressing staffing/resource adequacy, general job demands, or task-level (external) workload conditions would improve patient and nurse outcomes. However, the causal inferences and design prospects change when one examines a full model, as in Figure 2, where each workload-outcome relationship is adjusted for the effect of the other workload types, and outcomes are free to covary. Following such adjustment, only unit- and task-level (external) workload uniquely relate to the outcomes, and not uniformly so. The multivariate findings suggest to the scientist or designer a deeper understanding of causal mechanisms: for example, the effect of job demands on errors might be mediated by external workload (i.e., related to interruptions, divided attention, and rushing) during the medication administration task. Thus, a cognitive performance mechanism could be posited to explain medication errors78 and the designer might realize that for an intervention at the job design level to be successful, it would have to address the task performance factors associated with the medication administration task. This would not be evident from univariate findings.
This is not the first study whose findings question whether staffing ratios are truly predictive of patient safety,16 31 79 80 raising the possibility that staffing interventions may not be as effective for reducing errors, morbidity or mortality as previously thought, or that only staffing interventions that affect task-level workload will be effective. On the other hand, as expected, workload associated with the medication administration task was related to perceived likelihood of medication error.81–84 Unexpectedly, the task-level workload measure turned out to have two components, an internal one related to mental effort and concentration, and an external one related to exogenous demands of the task. Only the external component was related to patient safety outcomes. This finding requires further analysis and study. One hypothesis might be that mental effort and concentration are beneficial consequences of certain work demands. Perhaps in nursing, some amount of this makes work more satisfying, buffers against burnout, and improves patient outcomes through superior performance. Figure 3 shows a comparison of the effect on medication error likelihood of external (upper panel) and internal (lower panel) workload. As suggested here, increases in external workload have deleterious effects on error likelihood, whereas the parabolic error-by-internal workload function is in line with the idea that there are performance benefits to concentration and mental effort at higher magnitudes of these conditions. (This finding is reminiscent of, but not necessarily the same as the parabolic arousal-performance relationship of the Yerkes-Dodson Law.85) If true, there will be implications for introducing automation and work methods that reduce concentration and effort and make work simpler.86 For example, researchers and organizations studying bar-coded medication administration (BCMA) systems, should consider evaluating their impact on clinicians’ workload.
Figure 3.

Perceived likelihood of medication error as a function of external (upper panel) and internal (lower panel) task-level workload.
Limitations
The use of subjective measures, such as self-reported workload in this study, is the topic of much discussion.87 Because workload is a construct that is internal to a worker,88 89 some argue that “there is no other way to measure such concepts as workload … directly unless we ask the participant.”90 What is most important in respect to measuring subjective workload is intersubjectivity, or, roughly, the degree to which multiple respondents interpret the questions of the measurement instrument in a similar way.91 The current study took several steps to achieve acceptable intersubjectivity. First, all questions were based on widely used instruments with established validity; second, most constructs were faceted; third, question wording was carefully chosen to reflect commonly understood terminology; fourth, and most importantly, numerous cognitive interviews were conducted in order to evaluate how nurses interpreted survey questions.
A subjective measure of medication error merits careful attention. On the one hand, an internal assessment of error likelihood might have as great an impact as does “objective reality.” Safety related behavior such as error reporting, taking risks, and taking safety precautions, is to a great extent based on risk perception, accurate or not.92–96 On the other hand, patient safety experts are most interested in actual error rates, and subjective assessments of error likelihood are most valuable if they reflect this actuality. Even allowing that nurses’ assessments reflect actual error likelihood, the use of subjective error measurement is a limitation of this study. Ongoing analysis of medication error observation at both hospitals will, in the future, provide an objective unit-based error likelihood value that can be used to validate and supplement the self-reported measure.
A further limitation is the inability to assess the direction of causality beyond the theoretical plausibility of the proposed causal model. Another limitation is that workload, a construct purported to exist at multiple levels, was measured by asking individuals. In future studies, this limitation can be addressed through aggregation, consideration of nesting and measurement of workload directly at the level of interest.97 Our specification of task-level workload was limited in that it focused on a single, albeit important, task, and that it focused primarily on mental demands of the task. Nevertheless, the findings presented here speak to the importance of medication administration-related (external) mental workload.
CONCLUSION
In sum, a study carried out at six nursing units at two pediatric hospitals provided interesting possibilities for how different types of workload may relate to common patient and employee problems in pediatric clinical settings. The findings inspire further workload research and a continued multiple-level approach to the study and policy- and design-based resolution of workload in health care.
Based on study findings, human factors design solutions include:
Base staffing, assignment, and work design decisions on multiple measures of workload, not only on patient census, staffing counts, or patient classification systems.
Reduce workload during medication administration by minimizing interruptions, concurrent demands, and time pressure. 29 98
When administration tasks cannot be redesigned, technological interventions such as point-of-care BCMA systems might help detect workload-induced errors before they reach the patient. However, in order to be effective, technologies such as BCMA must be designed and implemented according to good usability and implementation practices.99–103
Do not indiscriminately reduce demands for mental effort and concentration, as these may be beneficial for patient and employee safety. Instead, a task analysis can identify instances in which concentration and effort are important and should be supported, and instances during which they can be alleviated with periods of low mental activity. Related, technologic aids or automation may inadvertently reduce the need for concentration or effort, which may not be advisable.
Maintain staffing adequacy. However, if adding staff is not feasible, human factors solutions can be directed at better allocation of work on the unit104 105 or better communication and teamwork.
When redesigning work, changes must be made to the proper level of workload: for example, to reduce errors, general job redesign must include support of medication administration tasks. Care should be taken not to increase one type of workload in an attempt to reduce another.
Finally, further work would benefit from measures of system causes of workload, a broader set of workload measures (e.g., capturing physical and emotional demands,49 including physiologic indicators of strain,106 or focusing on other clinical tasks such as extubation107), and measures of other outcomes of interest, such as safety protocol violations, technology use, perceived quality of care, medication-related injury, turnover, and patient satisfaction. Work should continue, especially, in high-risk populations such as pediatrics, critical care, and hematology-oncology. Although earlier studies were sufficient to alert us to workload problems, much more remains to be done in the conceptualization and measure of workload in order to understand the mechanisms at play, a prerequisite for design or engineering interventions to succeed.
Acknowledgments
The Corresponding Author has the right to grant on behalf of all authors and does grant on behalf of all authors, an exclusive license (or non exclusive for government employees) on a worldwide basis to the BMJ Publishing Group Ltd to permit this article (if accepted) to be published in QSHC and any other BMJPGL products and sublicenses such use and exploit all subsidiary rights, as set out in our license (http://qshc.bmjjournals.com/misc/ifora/licenceform.shtml).
We thank study participants and everyone involved in the “Bar Coding and Patient and Employee Safety” study. We also thank the anonymous reviewers, Alexander Alonso, and Yoel Donchin for their helpful feedback. A presentation at the 2007 Human Factors and Ergonomics Society Annual Meeting contained a preliminary presentation of these workload data.
FUNDING
This work was supported in part by a grant from the Agency for Healthcare Research and Quality (1 R01 HS013610) to author BK. The Agency for Healthcare Research and Quality had no role in the study or publication except for providing funding for the study. Author R.J.H. was supported by a training grant from the US National Institutes of Health (1 TL1 RR025013-01).
Glossary
- PICU
pediatric intensive care unit
- HOT
hematology-oncology-transplant unit
- MED
general medical/surgical unit
- FDR
False Discovery Rate
- OR
odds ratio
- BCMA
Bar-coded medication administration
Footnotes
COMPETING INTERESTS
None of the authors has any competing interests.
References
- 1.Institute of Medicine. To Err is Human: Building a Safer Health System. Institute of Medicine Report on Medical Errors. Washington, DC: National Academies Press; 2000. [PubMed] [Google Scholar]
- 2.Institute of Medicine. Crossing the quality chasm: a new health system for the 21st century. Washington, DC: National Academies Press; 2001. [PubMed] [Google Scholar]
- 3.Institute of Medicine. Patient Safety: Achieving a New Standard for Care. Washington, DC: National Academies Press; 2004. [PubMed] [Google Scholar]
- 4.Institute of Medicine. Keeping Patients Safe: Transforming the Work Environment of Nurses. Washington, DC: National Academies Press; 2004. [PubMed] [Google Scholar]
- 5.Institute of Medicine. Building a Better Delivery System: A New Engineering/Health Care Partnership. Washington, DC: National Academies Press; 2005. [Google Scholar]
- 6.Bogner MS. Human error in medicine. Hillsdale, NJ: Lawrence Erlbaum Associates, Inc; 1994. [Google Scholar]
- 7.Reason J. Human error: Models and management. British Medical Journal. 2000;320:768–770. doi: 10.1136/bmj.320.7237.768. [DOI] [PMC free article] [PubMed] [Google Scholar]
- 8.Karsh B, Holden RJ, Alper SJ, Or KL. A human factors engineering paradigm for patient safety – designing to support the performance of the health care professional. Quality and Safety in Healthcare. 2006;15(Suppl I):i59–i65. doi: 10.1136/qshc.2005.015974. [DOI] [PMC free article] [PubMed] [Google Scholar]
- 9.Picket RM, Triggs TJ, editors. Human factors in health care. Lexington, MA: DC Heath & Co; 1975. [Google Scholar]
- 10.Berwick DM. Not again! Preventing errors lies in redesign — not exhortation. British Medical Journal. 2001;322:247–248. [Google Scholar]
- 11.Carayon P, editor. Handbook of human factors and ergonomics in patient safety. Mahwah, NJ: Lawrence Erlbaum Associates; 2006. [Google Scholar]
- 12.Gosbee J. Human factors engineering and patient safety. Quality and Safety in Healthcare. 2002;11:352–354. doi: 10.1136/qhc.11.4.352. [DOI] [PMC free article] [PubMed] [Google Scholar]
- 13.Goldmann D, Kaushal R. Time to tackle the tough issues in patient safety. Pediatrics. 2002;110(4):823–826. doi: 10.1542/peds.110.4.823. [DOI] [PubMed] [Google Scholar]
- 14.Page A, editor. Keeping patients safe: transforming the work environment of nurses. Washington, DC: National Academies Press; 2004. [PubMed] [Google Scholar]
- 15.Aspden P, Corrigan JM, Wolcott J, Erickson SM, editors. Patient safety: achieving a new standard for care. Washington, DC: National Academies Press; 2004. [PubMed] [Google Scholar]
- 16.Hurst K. Relationship between patient dependency, nursing workload and quality. International Journal of Nursing Studies. 2005;42:75–84. doi: 10.1016/j.ijnurstu.2004.05.011. [DOI] [PubMed] [Google Scholar]
- 17.Trueland J. Scottish workload report receives warm welcome. Nursing Standard. 2004;18(34):8. [Google Scholar]
- 18.Workload measure to benefit all. Australian Nursing Journal. 2004;12(2):11. [Google Scholar]
- 19.Brady A-M, Byrne G, Horan P, Griffiths C, MacGregor C, Begley C. Measuring the workload of community nurses in Ireland: a review of workload measurement systems. Journal of Nursing Management. 2007;15:481–489. doi: 10.1111/j.1365-2834.2007.00663.x. [DOI] [PubMed] [Google Scholar]
- 20.Healthcare Commission. Ward staffing. London: Commission for Healthcare Audit and Inspection; 2005. [Google Scholar]
- 21.Aiken LH, Clarke SP, Sloane DM, Sochalski J, Silber JH. Hospital nurse staffing and patient mortality, nurse burnout, and job dissatisfaction. JAMA-Journal of the American Medical Association. 2002;288(16):1987–1993. doi: 10.1001/jama.288.16.1987. [DOI] [PubMed] [Google Scholar]
- 22.Davidson H, Folcarelli RH, Crawford S, Duprat LJ, Clifford JC. The effects of healthcare reform in job satisfaction and voluntary turnover among hospital-based nurses. Medical Care. 1997;35(6):634–645. doi: 10.1097/00005650-199706000-00008. [DOI] [PubMed] [Google Scholar]
- 23.Kazanjian A, Green C, Wong J, Reid R. Effect of the hospital nursing environment on patient mortality: a systematic review. Journal of Health Services and Research Policy. 2005;10(2):111–117. doi: 10.1258/1355819053559100. [DOI] [PubMed] [Google Scholar]
- 24.Lang TA, Hodge M, Olson V, Romano PS, Kravitz RL. Nurse-patient ratios: a systematic review on the effects of nurse staffing on patient, nurse employee, and hospital outcomes. Journal of Nursing Administration. 2004;34(7/8):326–337. doi: 10.1097/00005110-200407000-00005. [DOI] [PubMed] [Google Scholar]
- 25.McVicar A. Workplace stress in nursing: a literature review. Journal of Advanced Nursing. 2003;44(6):633–642. doi: 10.1046/j.0309-2402.2003.02853.x. [DOI] [PubMed] [Google Scholar]
- 26.Needleman J, Buerhaus P, Mattke S, Stewart M, Zelevinsky K. Nurse-staffing levels and the quality of care in hospitals. New England Journal of Medicine. 2002;346(22):1715–1722. doi: 10.1056/NEJMsa012247. [DOI] [PubMed] [Google Scholar]
- 27.Mark BA, Harless DW, McCue M, Xu Y. A longitudinal examination of hospital registered nurse staffing and quality of care. HSR: Health Services Research. 2004;39(2):279–300. doi: 10.1111/j.1475-6773.2004.00228.x. [DOI] [PMC free article] [PubMed] [Google Scholar]
- 28.Sochalski J. Is more better?: the relationship between nurse staffing and the quality of nursing care in hospitals. Medical Care. 2004;42(2 Suppl:I):ii67–ii73. doi: 10.1097/01.mlr.0000109127.76128.aa. [DOI] [PubMed] [Google Scholar]
- 29.Weissman JS, Rothschild JM, Bendavid E, Sprivulis P, Cook EF, Evans S, et al. Hospital workload and adverse events. Medical Care. 2007;45:448–455. doi: 10.1097/01.mlr.0000257231.86368.09. [DOI] [PubMed] [Google Scholar]
- 30.Lambert VA, Lambert CE, Petrini M, Li XM, Zhang YJ. Predictors of physical and mental health in hospital nurses within the People's Republic of China. International Nursing Review. 2007;54:85–91. doi: 10.1111/j.1466-7657.2007.00512.x. [DOI] [PubMed] [Google Scholar]
- 31.Seki Y, Yamazaki Y. Effects of working conditions on intravenous medication errors in a Japanese hospital. Journal of Nursing Management. 2006;14:128–139. doi: 10.1111/j.1365-2934.2006.00597.x. [DOI] [PubMed] [Google Scholar]
- 32.Czapilinksi C, Diers D. The effect of staff nursing on length of stay and mortality. Medical Care. 1998;36:1626–1638. doi: 10.1097/00005650-199812000-00002. [DOI] [PubMed] [Google Scholar]
- 33.Tarnow-Mordi WO, Hau C, Warden A, Shearer AJ. Hospital mortality in relation to staff workload: a 4-year study in an adult intensive-care unit. Lancet. 2000;356:185–189. doi: 10.1016/s0140-6736(00)02478-8. [DOI] [PubMed] [Google Scholar]
- 34.Rafferty AM, Clarke SP, Coles J, Ball J, James P, McKee M, et al. Outcomes of variation in hospital nurse staffing in English hospitals: cross-sectional analysis of survey data and discharge records. International Journal of Nursing Studies. 2007;44:175–182. doi: 10.1016/j.ijnurstu.2006.08.003. [DOI] [PMC free article] [PubMed] [Google Scholar]
- 35.Estabrooks CA, Midodzi WK, Cummings GG, Ricker KL, Giovannetti P. The impact of hospital nursing characteristics on 30-day mortality. Nursing Research. 2005;54(2):74–84. doi: 10.1097/00006199-200503000-00002. [DOI] [PubMed] [Google Scholar]
- 36.Aiken LH, Clarke SP, Sloane DM, Sochalski J, Busse R, Clarke H, et al. Nurses' reports on hospital care in five countries. Health Affairs. 2001;20(3):43–53. doi: 10.1377/hlthaff.20.3.43. [DOI] [PubMed] [Google Scholar]
- 37.Aiken LH, Clarke SP, Sloane DM. Hospital staffing, organization, and quality of care: cross-national findings. International Journal for Quality in Health Care. 2002;14(1):5–13. doi: 10.1093/intqhc/14.1.5. [DOI] [PubMed] [Google Scholar]
- 38.Workload a safety risk. Australian Nursing Journal. 2007;14(10):p3. [Google Scholar]
- 39.McGillis Hall L, Kiesners D. A narrative approach to understanding the nursing work environment in Canada. Social Science & Medicine. 2005;61:2482–2491. doi: 10.1016/j.socscimed.2005.05.002. [DOI] [PubMed] [Google Scholar]
- 40.Hurley ML. Workload, UAPs, and you. RN. 2000;63(12):47–49. [PubMed] [Google Scholar]
- 41.Bathen S. Nursing ratios. StateNet California Journal. 2004;59(15):16. [Google Scholar]
- 42.Sparks SA, Corcoran KJ, Nabors LA, Hovanitz CA. Job satisfaction and subjective well-being in a sample of nurses. Journal of Applied Social Psychology. 2005;35(5):922–938. [Google Scholar]
- 43.Carayon P, Gurses AP. A human factors engineering conceptual framework of nursing workload and patient safety in intensive care units. Intensive and Critical Care Nursing. 2005;21:284–301. doi: 10.1016/j.iccn.2004.12.003. [DOI] [PubMed] [Google Scholar]
- 44.O'Brien-Pallas L, Irvine D, Peereboom E, Murray M. Measuring nursing workload: understanding the variability. Nursing Economics. 1997;15(4):171–182. [PubMed] [Google Scholar]
- 45.Unruh LY, Fottler MD. Patient turnover and nursing staff adequacy. HSR: Health Services Research. 2006;41(2):599–612. doi: 10.1111/j.1475-6773.2005.00496.x. [DOI] [PMC free article] [PubMed] [Google Scholar]
- 46.O’Brien AJ, Abas M, Christensen J, Nicholls TH, Prou TL, Hekau A, et al. Nursing workload measurement in acute mental health inpatient units. Auckland, New Zealand: Health Research Council of New Zealand; 2002. [Google Scholar]
- 47.Pearson A, O'Brien-Pallas L, Thomson D, Doucette E, Tucker D, Wiechula R, et al. Systematic review of evidence on the impact of nursing workload and staffing on establishing healthy work environments. International Journal of Evidence Based Healthcare. 2006;4:337–384. doi: 10.1111/j.1479-6988.2006.00055.x. [DOI] [PubMed] [Google Scholar]
- 48.Adomat R, Hicks C. Measuring nursing workload in intensive care: an observational study using closed circuit video cameras. Journal of Advanced Nursing. 2003;42(4):402–412. doi: 10.1046/j.1365-2648.2003.02632.x. [DOI] [PubMed] [Google Scholar]
- 49.Carayon P, Alvarado CJ. Workload and patient safety among critical care nurses. Critical Care Nursing Clinics of North America. 2007;19:121–129. doi: 10.1016/j.ccell.2007.02.001. [DOI] [PubMed] [Google Scholar]
- 50.Xie B, Salvendy G. Review and reappraisal of modelling and predicting mental workload in single- and multi-task environments. Work and Stress. 2000;14(1):74–99. [Google Scholar]
- 51.Karasek RA. Job demands, job decision latitude, and mental strain, implications for job redesign. Administrative Science Quarterly. 1979;24:285–307. [Google Scholar]
- 52.Hurrell JJ, McLaney MA. Control, job demands, and job satisfaction. In: Sauter S, Hurrell JJ, Cooper CL, editors. Job Control and Worker Health. Chichester, NY: John Wiley and Sons; 1989. pp. 97–103. [Google Scholar]
- 53.Hart SG, Staveland LE. Development of NASA-TLX (Task Load Index): Results of empirical and theoretical research. In: Hancock PA, Meshkati N, editors. Human Mental Workload. Amsterdam: North-Holland; 1988. pp. 139–183. [Google Scholar]
- 54.Reid GB, Nygren TE. The subjective workload assessment technique: A scaling procedure for measuring mental workload. In: Hancock PA, Meshkati N, editors. Human Mental Workload. Amsterdam: North-Holland; 1988. pp. 185–218. [Google Scholar]
- 55.Rubio S, Díaz E, Martín J, Puente J. Evaluation of subjective mental workload: a comparison of SWAT, NASA-TLX, and workload profile methods. Applied Psychology: An International Review. 2004;53(1):61–86. [Google Scholar]
- 56.Forsyth BH, Rothgeb JM, Willis GB. Does pretesting make a difference? In: Presser S, Rothgeb JM, Couper MP, Lessler JT, Martin E, Singer E, editors. Questionnaire Development Evaluation and Testing Methods. New York: Wiley; 2004. [Google Scholar]
- 57.Groves RM, Fowler FJ, Couper MP, Lepkowski JM, Singer E, Tourangeau R. Survey Methodology. Hoboken, NJ: Wiley-Interscience; 2004. [Google Scholar]
- 58.Presser S, Blair J. Survey pretesting: Do different methods produce different results? In: Marsden P, editor. Sociology Methodology. Washington, DC: American Sociological Association; 1994. pp. 73–104. [Google Scholar]
- 59.Graesser A, Bommareddy S, Swamer S, Golding J. Intergrating questionnaire design with a cognitive computational model of human question answering. In: Schwarz N, Sudman S, editors. Answering Questions. San Francisco: Jossey-Bass; 1996. pp. 143–174. [Google Scholar]
- 60.Lessler JT, Forsyth B. A coding system for appraising questionnaires. In: Schwarz N, Sudman S, editors. Answering Questions. San Francisco: Jossey-Bass; 1996. pp. 259–292. [Google Scholar]
- 61.Lessler JT, Tourangeau R, Salter W. Vital and Health Statistics, Series 6 (No 1) Hyattsville, MD: US Department of Health and Human Services; 1989. Questionnaire design research in the cognitive research laboratory. DHHS Publication No, (PHS) 89–1076. [Google Scholar]
- 62.Tourangeau R, Rips L, Rasinski K. The psychology of survey response. Cambridge: Cambridge University Press; 2000. [Google Scholar]
- 63.Willis GB. Cognitive interviewing: a “how to“ guide. Research Triangle Park, NC: Research Triange Institute; 1999. [Google Scholar]
- 64.Willis GB. Cognitive Interviewing: A Tool for Improving Questionnaire Design. Thousand Oaks, CA: Sage; 2004. [Google Scholar]
- 65.Willis GB. Cognitive interviewing revisited: a useful technique, in theory? In: Presser S, Rothgeb JM, Couper MP, Lessler JT, Martin E, Martin J, et al., editors. Methods for testing and evaluating survey questionnaires. New York: Wiley; 2004. [Google Scholar]
- 66.Aspden P, Wolcott J, Bootman JL, Cronenwett LR, editors. Preventing medication errors: quality chasm series. Washington, DC: National Academies Press; 2007. [Google Scholar]
- 67.Cohen MR. Medication errros. 2. Washington, DC: American Pharmaceutical Association; 2006. [Google Scholar]
- 68.Aiken LH, Patrician PA. Measuring organizational traits of hospitals: the revised Nursing Work Index. Nursing Research. 2000;43:146–153. doi: 10.1097/00006199-200005000-00006. [DOI] [PubMed] [Google Scholar]
- 69.Jackson PR, Wall TD, Martin R, Davids K. New measures of job control, cognitive demand, and production responsibility. Journal of Applied Psychology. 1993;78(5):753–762. [Google Scholar]
- 70.Cammann C, Fichman M, Jenkins D, Klesh J. Assessing the attitudes and perceptions of organizational members. In: Seashore S, Lawler E, Mirvis P, Cammann C, editors. Assessing Organizational Change: A Guide to Methods, Measures and Practices. New York: Wiley; 1983. [Google Scholar]
- 71.Maslach C, Jackson SE. Maslach Burnout Inventory. University of California; Berkeley: 1981. [Google Scholar]
- 72.Guo G, Zhao H. Multilevel modeling for binary data. Annual Review of Sociology. 2000;26:441–462. [Google Scholar]
- 73.Huber PJ. The behavior of maximum likelihood estimates under non-standard conditions. Proceedings of the Fifth Berkeley Symposium on Mathematical Statistics and Probability. 1967;1:221–233. [Google Scholar]
- 74.Benjamini Y, Hochberg Y. Controlling the false discovery rate: a practical and powerful approach to multiple testing. Journal of the Royal Statistical Society B. 1995;57:289–300. [Google Scholar]
- 75.Storey JD. A direct approach to false discovery rates. Journal of the Royal Statistical Society B. 2002;64:479–498. [Google Scholar]
- 76.Storey JD. The positive false discovery rate: A Bayesian interpretation and the q-value. The Annals of Statistics. 2003 [Google Scholar]
- 77.Health Research and Services Administration. The Registered Nurse Population: Findings from the 2004 National Sample Survey of Registered Nurses. http://bhpr.hrsa.gov/healthworkforce/rnsurvey04/
- 78.Grasha AF, Schell K. Psychosocial factors, workload, and human error in a simulated pharmacy dispensing task. Perceptual & Motor Skills. 2001;92(1):53–71. doi: 10.2466/pms.2001.92.1.53. [DOI] [PubMed] [Google Scholar]
- 79.Seago JA. Nurse staffing, models of care delivery, and interventions. In: Shojania K, Duncan B, McDonald K, Wachter R, editors. Making health care safer: a critical analysis of patient safety practices. Rockville, MD: AHRQ; 2001. pp. 423–446. [PMC free article] [PubMed] [Google Scholar]
- 80.Potter P, Barr N, McSweeney M, Sledge J. Identifying nurse staffing and patient outcome relationships: a guide for change in care delivery. Nursing Economics. 2003;21(4):158–166. [PubMed] [Google Scholar]
- 81.Blegen MA, Goode CJ, Reed L. Nurse staffing and patient outcomes. Nursing Research. 1998;47(1):43–50. doi: 10.1097/00006199-199801000-00008. [DOI] [PubMed] [Google Scholar]
- 82.Tang F-I, Sheu S-J, Yu S, Wei I-L, Chen C-H. Nurses relate the contributing factors involved in medication errors. Journal of Clinical Nursing. 2007;16:447–457. doi: 10.1111/j.1365-2702.2005.01540.x. [DOI] [PubMed] [Google Scholar]
- 83.Rogers AE, Hwang W-T, Scott LD, Aiken LH, Dinges DF. The working hours of hospital staff nurses and patient safety. Health Affairs. 2004;23(4):202–212. doi: 10.1377/hlthaff.23.4.202. [DOI] [PubMed] [Google Scholar]
- 84.Burke RJ. Hospital restructuring, workload, and nursing staff satisfaction and work experiences. Health Care Manager. 2003;22(2):99–107. doi: 10.1097/00126450-200304000-00003. [DOI] [PubMed] [Google Scholar]
- 85.Yerkes RM, Dodson JD. The relation of strength of stimulus to rapidity of habit-formation. Journal of Comparative Neurology and Psychology. 1908;18:459–482. [Google Scholar]
- 86.Technology’s role in addressing Maryland’s nursing shortage: innovations & examples: Technology Workgroup of the Maryland Statewide Commission on the Crisis in Nursing, 2004.
- 87.Stanton NA, Stammers RB. Creative (dis)agreement in ergonomics. Ergonomics. 2002;45(14):963–965. doi: 10.1080/00140130210166960. [DOI] [PubMed] [Google Scholar]
- 88.Sheridan TB, Stassen HG. Definitions, models and measures of human workload. In: Moray N, editor. Mental workload: its theory and measurement. New York: Plenum; 1979. [Google Scholar]
- 89.Moray N. Mental workload since 1979. International Review of Ergonomics. 1988;2:123–150. [Google Scholar]
- 90.Drury CG. Measurement and the practising ergonomist. Ergonomics. 2002;45(14):988–990. doi: 10.1080/00140130210166915. [DOI] [PubMed] [Google Scholar]
- 91.Annett J. Subjective rating scales: science or art? Ergonomics. 2002;45(14):966–987. doi: 10.1080/00140130210166951. [DOI] [PubMed] [Google Scholar]
- 92.DeJoy DM. Managing safety in the workplace: An attribution theory analysis and model. Journal of Safety Research. 1994;25:3. [Google Scholar]
- 93.Slovic P, Fischhoff B, Lichtenstein S. Behavioral decision theory perspectives on risk and safety. Acta Psychologica. 1984;56:183–203. [Google Scholar]
- 94.Wilder DA. Perceiving persons as a group: Effects on attributions of causality and beliefs. Social Psychology. 1978;41:13–23. [Google Scholar]
- 95.Amenolda A. Recent paradigms for risk informed decision making. Safety Science. 2001;40:17–30. [Google Scholar]
- 96.Rundmo T, Iversen H. Risk perception and driving behaviour among adolescents in two Norwegian counties before and after a traffic safety campaign. Safety Science. 2004;42:1–21. [Google Scholar]
- 97.Karsh B, Brown R. The impact of levels on theory, measurement, analysis, and intervention in medical error research: the case of patient safety health information technology. Applied Ergonomics. 2007 doi: 10.1016/j.apergo.2009.12.007. Accepted. [DOI] [PubMed] [Google Scholar]
- 98.Tucker AL, Spear SJ. Operational failures and interruptions in hospital nursing. HSR: Health Services Research. 2006;41:643–662. doi: 10.1111/j.1475-6773.2006.00502.x. [DOI] [PMC free article] [PubMed] [Google Scholar]
- 99.Holden RJ, Karsh B. A theoretical model of health information technology usage behaviour with implications for patient safety. Behaviour & Information Technology. 2007. pp. 1–17. (Pre-published online 01 January 2007: http://dx.doi.org/10.1080/01449290601138245)
- 100.Karsh B. Beyond usability for patient safety: designing effective technology implementation systems. British Medical Journal: Quality and Safety in Healthcare. 2004;13:388–394. doi: 10.1136/qshc.2004.010322. [DOI] [PMC free article] [PubMed] [Google Scholar]
- 101.Karsh B, Holden RJ. New technology implementation in health care. In: Carayon P, editor. Handbook of Human Factors and Ergonomics in Patient Safety. 2007. pp. 391–408. [Google Scholar]
- 102.Or KL, Valdez RS, Casper GR, Brennan PF, Carayon P, Karsh B. Human factors, ergonomics, and health information technology in home care – a perspective from work system analysis. WORK. 2008 doi: 10.3233/WOR-2009-0867. Accepted. [DOI] [PMC free article] [PubMed] [Google Scholar]
- 103.Karsh B, Scanlon M. When is a defibrillator not a defibrillator? When it is like a clock radio…. The challenge of usability and patient safety in the real world. Annals of Emergency Medicine. 2007;50:433–435. doi: 10.1016/j.annemergmed.2007.06.481. [DOI] [PubMed] [Google Scholar]
- 104.Mullinax C, Lawley M. Assigning patients to nurses in neonatal intensive care. Journal of the Operational Research Society. 2002;53:25–35. [Google Scholar]
- 105.Burke EK, De Causmaecker P, Vanden Berghe G, Van Landeghem H. The state of the art of nurse rostering. Journal of Scheduling. 2004;7:441–499. [Google Scholar]
- 106.Nuikka M-L, Paunonen M, Hänninen O, Länsimies E. The nurse's workload in care situations. Journal of Advanced Nursing. 2001;33(3):406–415. doi: 10.1046/j.1365-2648.2001.01676.x. [DOI] [PubMed] [Google Scholar]
- 107.Krayem A, Butler R, Martin C. Unplanned extubation in the ICU: impact on outcome and nursing workload. Annals of Thoracic Medicine. 2006;1(2):71–75. [Google Scholar]