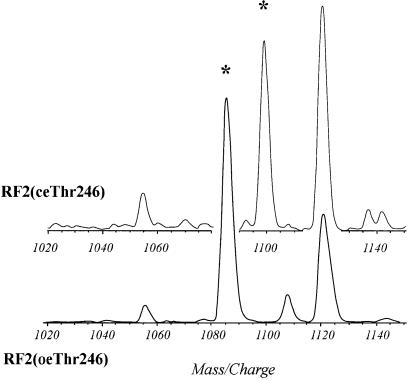
Fig. 4. MALDI-MS analysis of a tryptic digest of RF2(ceThr246) (upper) overlaid with a section of a MALDI-MS spectrum of a tryptic digest of RF2(oeThr246) (lower). The figure shows the increase in mass of the tryptic peptide 246–256 (marked with an asterisk) from RF2(ceThr246) as compared with the same peptide from RF2(oeThr246).

An official website of the United States government
Here's how you know
Official websites use .gov
A
.gov website belongs to an official
government organization in the United States.
Secure .gov websites use HTTPS
A lock (
) or https:// means you've safely
connected to the .gov website. Share sensitive
information only on official, secure websites.
