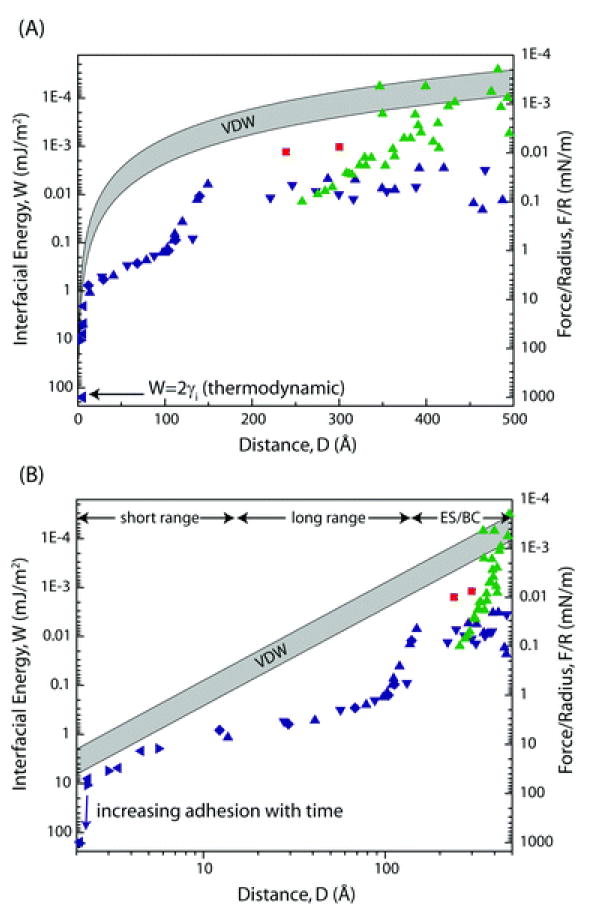
Fig. 1.

Results of experimentally measured forces between hydrophobic surfaces under different conditions presented as a semi-log (A) and a log-log (B) plot are indicated as followed: red squares: DMDOA, LB-deposited, deaerated, Wood and Sharma;31 green triangles: OTE, chemical vapor deposition, deaereted; all data points in blue were obtained by Meyer et al.,1 using OTE and DODA surfaces prepared by LB-depostion. Suggested regimes are marked as the short range, long range, and ES/BC, and are discussed below. The shaded VDW force band corresponds to Hamaker constants between 3 and 10 × 10−21 J.
