
Figure 2. Intermediates trapped during in crystallo oxidation of εA and 3-meT.
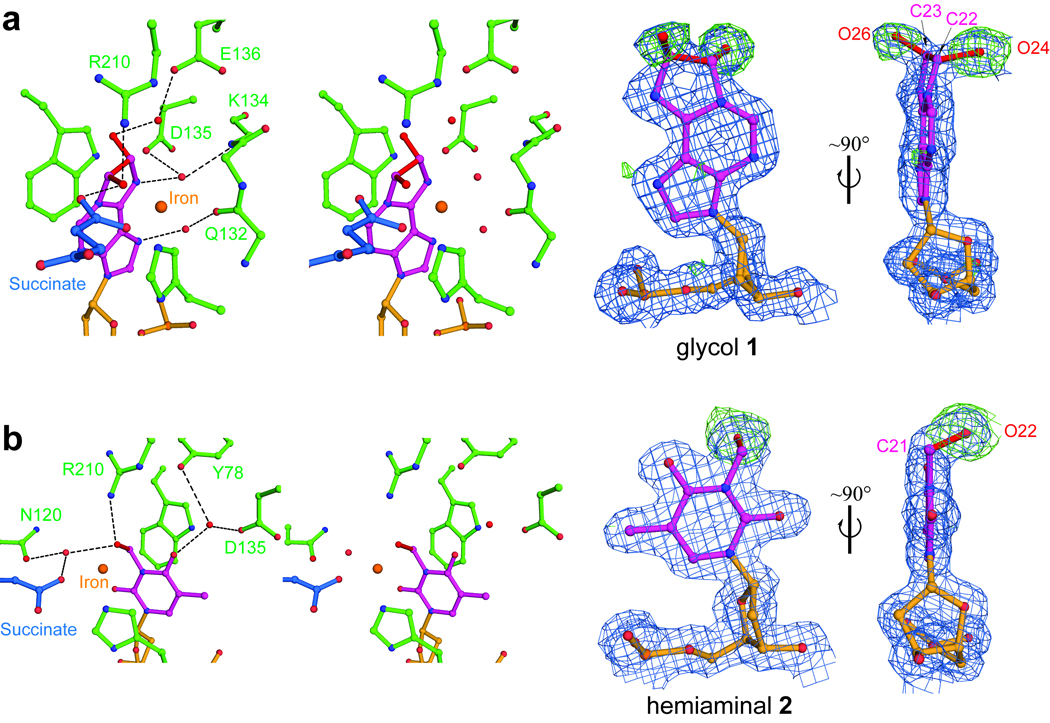
a, Stereo views and electron density maps of the glycol intermediate 1 during εA repair. b, Stereo pairs and density maps of the hemiaminal intermediate 2 during the oxidation demethylation of 3-meT. The blue 2Fobs-Fcal maps are contoured at 1.0σ and the green Fobs-Fcal simulated-annealing omit maps were computed by removing extra atoms of intermediates (compared to the original substrates) and are contoured at 3.0σ. The extra atoms are shown in red. Hydrogen bonds are shown as dotted lines.