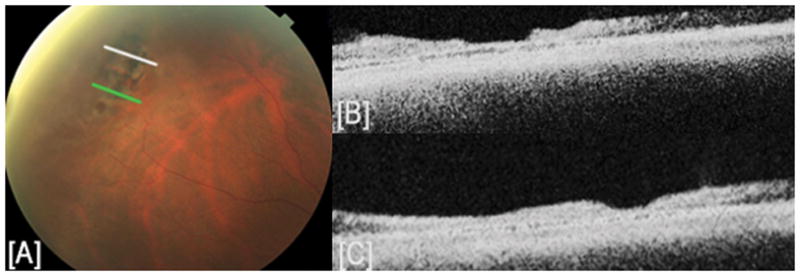
FIGURE 4. Retinal thinning.

(A) Color fundus photograph and (B, C) spectral domain optical coherence tomography (SD-OCT) images represented by white and green lines respectively on fundus image. The OCT images demonstrate overall retinal thinning over the lattice degeneration with generalized disruption of all retinal layers and a central area of increased thinning with loss of inner retinal tissue.
