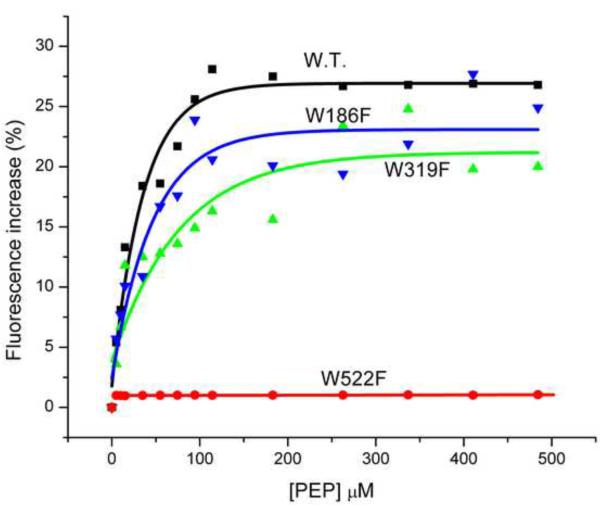
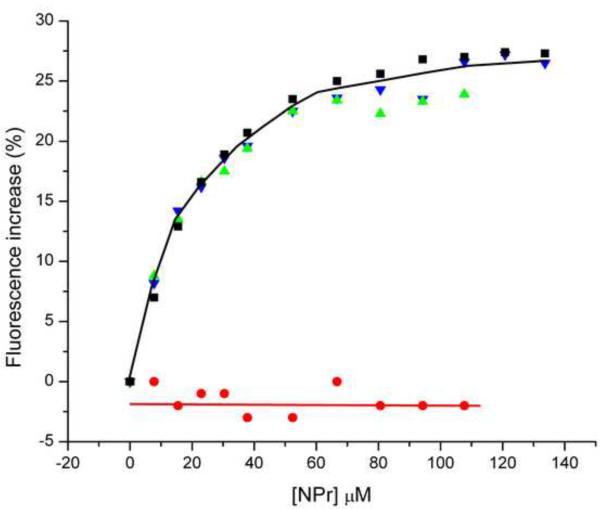
Figure 10. Fluorescence effects on PEP and NPr binding to Trp mutants of EINtr.
(A) PEP titration: Incubation conditions were as described for Fig. 13, except that the final concentrations of all the EINtr proteins used was 82 μg/ml. The baseline fluorescence intensities were: wild-type (filled squares), 42622; W186F (inverted triangles), 41324; W319F (triangles), 37487; W522F (circles), 28078. (B) NPr titration: incubation conditions were as in (A). The baseline fluorescence intensities were: wild-type, 42622; W186F, 72761; W319F, 87741; W522F, 51338.


